Asia: China, Japan & the region
Last updated: 2026 15 Oct, 09:46 AWST (Perth). Key charts are shown first; tap Show more under a topic for alternative views. All sections & traffic-light overview.
Traffic-light key
HEATING running hot / accelerating / tightening pressure building (e.g. inflation above target, rapid credit growth, rising yields, booming asset prices)
STEADY inside its normal range under the stated rule
COOLING slowing / weakening, or a restrictive setting that is exerting cooling pressure (e.g. high real rates, inverted curve)
STRESS dislocation signal: spreads or insolvencies surging, carry unwind, sharp drawdown, labour-market break (Sahm-style)
INFO context chart only, no traffic-light rule
STEADY inside its normal range under the stated rule
COOLING slowing / weakening, or a restrictive setting that is exerting cooling pressure (e.g. high real rates, inverted curve)
STRESS dislocation signal: spreads or insolvencies surging, carry unwind, sharp drawdown, labour-market break (Sahm-style)
INFO context chart only, no traffic-light rule
Summary from the latest data. Of the 29 rule-based indicators on this page, 8 are running hot, 16 are steady, 2 are cooling and 3 are flashing stress. The stress readings are in Property: starts, sales & investment, 70-city new home prices and Foreign net buying of Japanese equities & bonds. The hot readings include Producer prices, Exports (US$, 3-mo y/y), BoJ policy rate and 5 others. In the latest data, 10y government bond yields are at their highest since the data begin in 2012, and Korea exports are at their highest since the data begin in 2013.
China 12 charts
2heating 7steady 1cooling 2stress
Credit & property
0.9 % GDP +1.6pp over 1y
Down 0.3pt on the previous quarter.
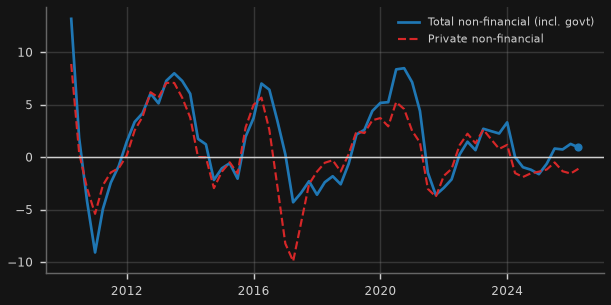
Why it matters for Australia: China's credit impulse has historically led its steel and construction demand, i.e. Australian iron ore volumes and prices, by 6-12 months.
Rule, caveat & sources caveat
Rule: 4-quarter change in 4-quarter credit flow as % of GDP: heating > +1pp; cooling < -1pp; otherwise steady. Rule applied to total non-financial sector (incl. government).
Caveat: Derived: GDP implied from BIS credit level / credit-to-GDP ratio. Proxy for TSF-based impulse (PBoC TSF not used). BIS data lag ~2 quarters.
Source: BIS Data Portal (WS_TC): Q.CN.C+P.A.M.XDC+770.A
-24.8% -2.2pp over 3m
Down 0.8pt on the previous month.
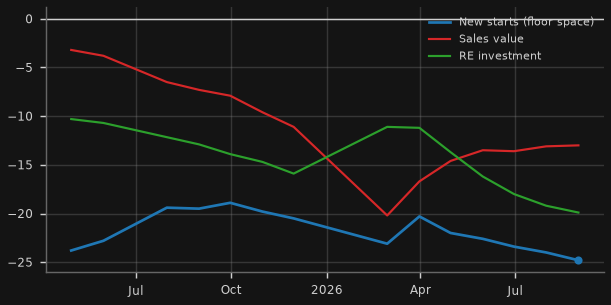
Why it matters for Australia: Chinese housing construction is the single biggest end-use of Australian iron ore.
Rule, caveat & sources caveat
Rule: New starts (floor space, YTD y/y): stress < -15%; cooling -15% to 0; heating > +5%; otherwise steady.
Caveat: Year-to-date cumulative growth rates; only releases since ~Aug-2025 parse fully.
Source: China NBS English press releases (scraped): Investment in Real Estate Development releases
Show 1 more credit & property chartHide 1 more credit & property chart70-city new home prices (avg y/y)
-3.3% +0.4pp over 3m
Up 0.1pt on the previous month.
Why it matters for Australia: Falling prices erode household wealth and developer collateral, the core of China's credit drag.
Rule, caveat & sources caveat
Rule: Stress < -3%; cooling -3% to 0; steady 0 to +3%; heating > +3%.
Caveat: Simple average across cities of NBS Table I indices (computed here; NBS does not publish a national average).
Source: China NBS English press releases (scraped): 70 city table I (new commercial residential)
Activity
NBS manufacturing PMISTEADY
50.1 -0.2 over 3m
Up 0.3 pts on the previous month.
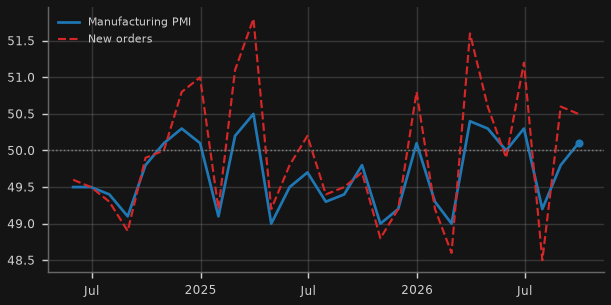
Why it matters for Australia: Factory momentum = steel, copper and energy demand from Australia's largest customer.
Rule, caveat & sources caveat
Rule: Heating >= 50.5; cooling < 49.5; otherwise steady (50 = no change).
Caveat: Parsed from NBS English releases; history limited to ~2 years of press releases. Caixin/S&P PMI is proprietary (not used).
Source: China NBS English press releases (scraped): Manufacturing PMI, new orders, non-manufacturing PMI
5.2% +0.7pp over 3m
Up 0.7pt on the previous month.
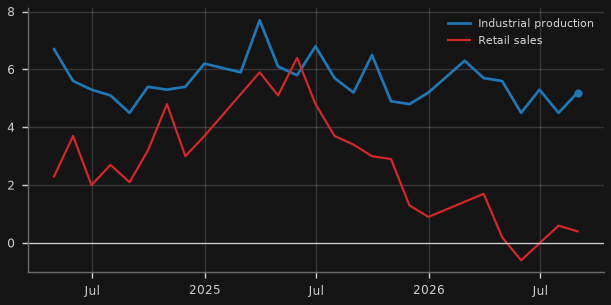
Why it matters for Australia: Supply (industry) vs demand (consumers): China's growth mix and its pull on Australian resources.
Rule, caveat & sources caveat
Rule: Industrial production y/y: heating > 6%; cooling < 4%; otherwise steady.
Caveat: Jan/Feb combined by NBS (no January print).
Source: China NBS English press releases (scraped): Industrial production, retail sales releases
Show 2 more activity chartsHide 2 more activity chartsNBS non-manufacturing PMI · Exports (US$, 3-mo y/y)
50.2 +0.0 over 3m
Up 1.2 pts on the previous month.
Why it matters for Australia: Services/construction activity: the domestic-demand side of China's rebalancing.
Rule & sources
Rule: Heating >= 50.5; cooling < 49.5; otherwise steady (50 = no change).
Source: China NBS English press releases (scraped): Non-manufacturing business activity index
Exports (US$, 3-mo y/y)HEATING
25.2% +13.3pp over 3m
Up 1.9pt on the previous month; highest since Oct 2021.
Why it matters for Australia: Export strength props up Chinese industry (and steel demand) while property is weak.
Rule, caveat & sources caveat
Rule: 3-month sum of USD exports, y/y: heating > +10%; cooling < 0%; otherwise steady.
Caveat: Verified vs China GAC: Aug-2026 exports US$401.44bn, +25.0% y/y in USD terms (+18.6% in CNY).
Source: OECD Data Explorer (DSD_IMTS@DF_IMTS): CHN.W.X.C.M.USD_EXC.N.N
Prices
CPI (y/y)STEADY
0.8% -0.4pp over 3m
Up 0.3pt on the previous month.
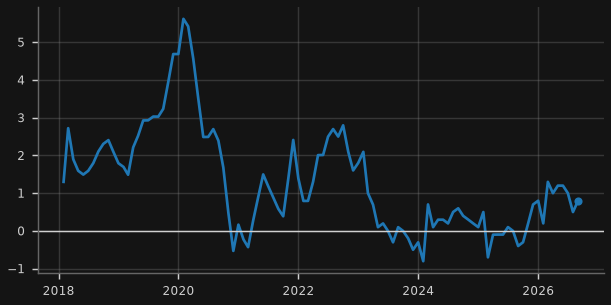
Why it matters for Australia: Low Chinese inflation exports disinflation (cheap goods) to Australia but signals weak domestic demand.
Rule, caveat & sources caveat
Rule: Cooling if < 0% (deflation); heating if > 2.5%; otherwise steady.
Caveat: BIS series with NBS release values where more recent.
Source: BIS Data Portal (WS_LONG_CPI): M.CN.771; China NBS English press releases (scraped): CPI release
Producer prices (y/y)HEATING
3.8% -0.1pp over 3m
Up 0.3pt on the previous month.
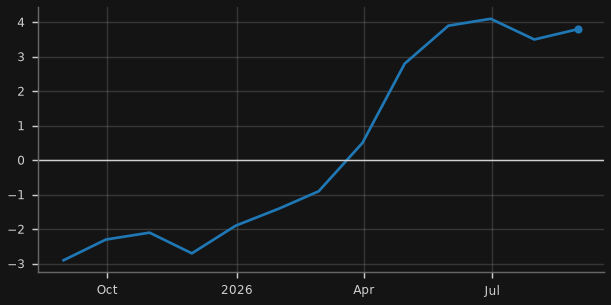
Why it matters for Australia: PPI tracks industrial pricing power; it moves with iron ore and coal prices.
Rule, caveat & sources caveat
Rule: Heating > +2%; cooling < -1%; otherwise steady.
Caveat: Only releases from Aug-2025 parse cleanly from NBS text (short history).
Source: China NBS English press releases (scraped): PPI release
Markets
1.69% -15bp over 1y
Down 0.02pt on the previous month; lowest since Jun 2025.
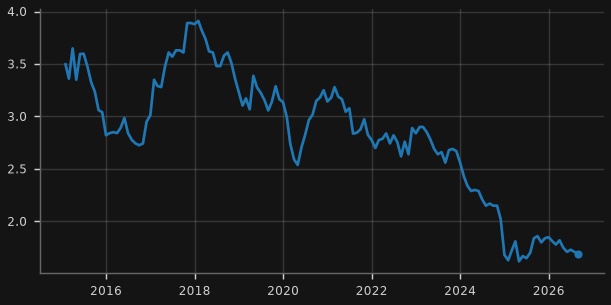
Why it matters for Australia: Record-low CGB yields signal deflationary pressure and weak credit demand.
Rule, caveat & sources caveat
Rule: 12-month change: cooling if <= -0.4pp; heating if >= +0.4pp; otherwise steady.
Caveat: Monthly average via OECD (lags ~1-2 months).
Source: OECD Data Explorer (DSD_STES@DF_FINMARK): CHN.M.IRLT.PA.....
USD/CNYSTEADY
6.6917 CNY -1.2% over 3m
Down 0.2% over the past week; lowest in the data back to 2023.
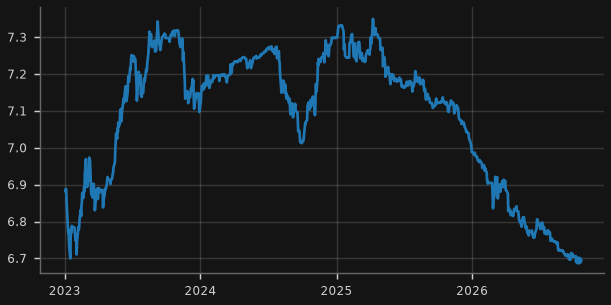
Why it matters for Australia: A weaker yuan exports deflation and usually coincides with softer commodity demand.
Rule, caveat & sources caveat
Rule: 3-month change: stress if CNY weakens > 3%; heating if CNY strengthens > 3%; otherwise steady.
Caveat: Cross rate derived from RBA 4pm AEST AUD rates.
Source: RBA table F11.1: FXRCR / FXRUSD (cross)
Show 1 more markets chartHide 1 more markets chartShanghai Composite & Hang Seng China Enterprises
8,175 -1.7% over 3m
Up 0.6% over the past week.
Why it matters for Australia: Chinese equity stress tends to spill into the AUD and Australian miners.
Rule & sources
Rule: HSCEI: stress if >= 20% below 52-week high; cooling if 10-20% below; heating if within 2% of the 52-week high; otherwise steady.
Source: Yahoo Finance chart endpoint (unofficial): 000001.SS, ^HSCE
Japan 10 charts
2heating 7steady 0cooling 1stress
Rates & yen
BoJ policy rateHEATING
1.25% +0.8pp over 1y
Unchanged over the past week.
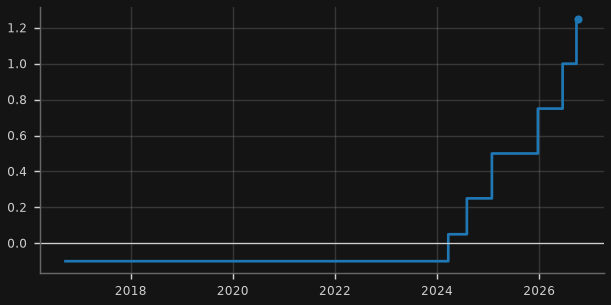
Why it matters for Australia: Each BoJ hike raises the cost of yen funding, the world's cheapest carry-trade leg.
Rule & sources
Rule: 12-month change: heating (tightening) if >= +0.25pp; cooling (easing) if <= -0.25pp; otherwise steady.
Source: BIS Data Portal (WS_CBPOL): D.JP
JGB 2y & 10y yieldsHEATING
3.019% +30bp over 3m
Down 0.08pt over the past week.
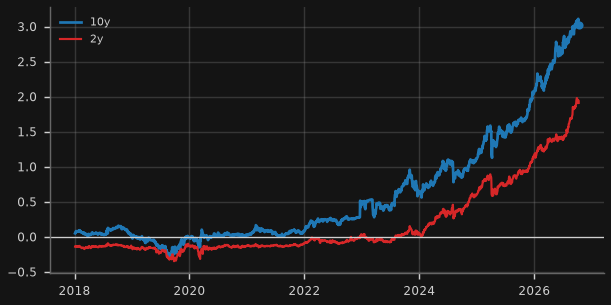
Why it matters for Australia: Higher JGB yields pull Japanese savings home, removing a big buyer of Australian and global bonds.
Rule & sources
Rule: 10y, 3-month change: heating if >= +20bp; cooling if <= -20bp; otherwise steady.
Source: Japan MOF JGB interest rates: jgbcme_all.csv + jgbcme.csv
USD/JPYSTEADY
158.15 JPY +1.6% over 1m
Down 0.2% over the past week.
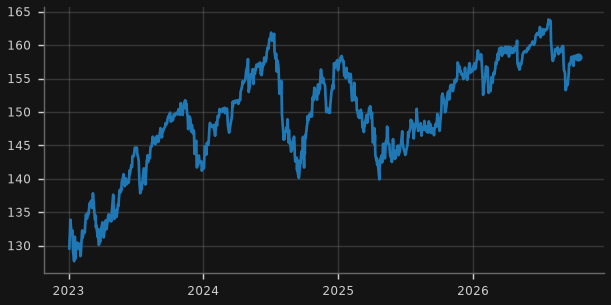
Why it matters for Australia: A sharp yen rally signals carry-trade unwinding, which has historically hit AUD and risk assets together.
Rule, caveat & sources caveat
Rule: Stress if yen strengthens >= 5% in 1 month (USD/JPY falls >= 5%); heating if yen weakens >= 5% over 3 months (carry building); otherwise steady.
Caveat: Cross rate derived from RBA 4pm AEST AUD rates.
Source: RBA table F11.1: FXRJY / FXRUSD (cross)
Show 2 more rates & yen chartsHide 2 more rates & yen chartsJGB 30y yield · AUD/JPY
JGB 30y yieldSTEADY
4.064% +20bp over 3m
Down 0.1pt over the past week.
Why it matters for Australia: Super-long JGBs are where fiscal/term-premium stress shows; spikes have hit global duration.
Rule & sources
Rule: Stress if 1-month change >= +40bp; heating if 3-month change >= +25bp; cooling if 3-month change <= -25bp; otherwise steady.
Source: Japan MOF JGB interest rates: jgbcme_all.csv + jgbcme.csv
AUD/JPYSTEADY
110.74 JPY +0.1% over 1m
Up 0.3% over the past week.
Why it matters for Australia: AUD/JPY is the purest carry-trade gauge for Australia: high-yielder vs funder.
Rule & sources
Rule: Stress if 1-month change <= -5%; heating if 3-month change >= +5%; otherwise steady.
Source: RBA table F11.1: FXRJY
Economy & flows
Japan CPI (y/y)STEADY
1.9% +0.6pp over 3m
Up 0.2pt on the previous month.
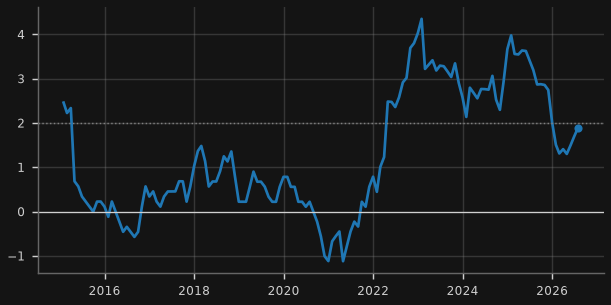
Why it matters for Australia: Sustained inflation is what lets the BoJ keep hiking (and JGB yields keep rising).
Rule, caveat & sources caveat
Rule: Heating > 2.5%; cooling < 1.5%; otherwise steady.
Caveat: BIS headline CPI (OECD/FRED Japan CPI series are stale); wages/shunto data need e-Stat API key (not used).
Source: BIS Data Portal (WS_LONG_CPI): M.JP.771
-1.8 ¥tn latest week -0.35tn
Down +0.1 ¥tn over the past week.
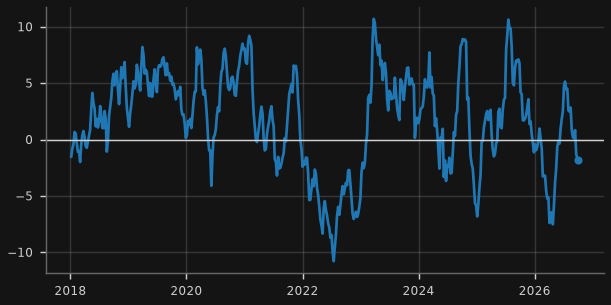
Why it matters for Australia: Japanese investors are major holders of Australian and US bonds; repatriation lifts global yields.
Rule, caveat & sources caveat
Rule: Percentile of trailing 10 years: stress <= 10th (heavy repatriation); heating >= 90th (heavy foreign buying); otherwise steady.
Caveat: Weekly designated-investor reports (MOF); sum of 13 weeks; units ¥ trillion (source 100m yen).
Source: Japan MOF International Transactions in Securities (weekly): week.csv
Show 3 more economy & flows chartsHide 3 more economy & flows chartsForeign net buying of Japanese equities & bonds (13-wk, ¥tn) · Nikkei 225 · Japan exports (US$, 3-mo y/y)
-3.2 ¥tn latest week equities +2.19tn
Up +2.2 ¥tn over the past week.
Why it matters for Australia: Foreign flows into Japan are a read on global risk appetite towards Asia.
Rule & sources
Rule: Equities, percentile of trailing 10 years: stress <= 10th; heating >= 90th; otherwise steady.
Source: Japan MOF International Transactions in Securities (weekly): week.csv
Nikkei 225STEADY
67,778 +1.4% over 3m
Down 4.1% over the past week.
Why it matters for Australia: Japanese equity drawdowns often coincide with yen-carry unwinds.
Rule & sources
Rule: Nikkei 225: stress if >= 20% below 52-week high; cooling if 10-20% below; heating if within 2% of the 52-week high; otherwise steady.
Source: Yahoo Finance chart endpoint (unofficial): ^N225
9.8% +4.6pp over 3m
Up 1.2pt on the previous month; highest since Oct 2021.
Why it matters for Australia: Japanese exports track the Asian manufacturing cycle that Australian LNG and coal feed.
Rule & sources
Rule: 3-month sum of USD exports, y/y: heating > +10%; cooling < 0%; otherwise steady.
Source: OECD Data Explorer (DSD_IMTS@DF_IMTS): JPN.W.X.C.M.USD_EXC.N.N
Asia region: policy, inflation & yields 9 charts
4heating 2steady 1cooling 0stress
Trade & tech cycle
27.1% +12.3pp over 3m
Up 2.3pt on the previous month; highest since Aug 2021.
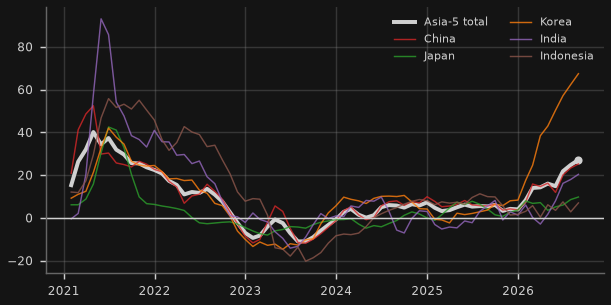
Why it matters for Australia: Regional export momentum = demand for Australian energy, metals and services.
Rule, caveat & sources caveat
Rule: 3-month sum of USD exports, y/y: heating > +10%; cooling < 0%; otherwise steady. Aggregate of China, Japan, Korea, India, Indonesia (months where all five report).
Caveat: Taiwan and Vietnam are not in OECD IMTS (Taiwan customs has no free bulk API); aggregate stops at the latest month all five report.
Source: OECD Data Explorer (DSD_IMTS@DF_IMTS): CHN+JPN+KOR+IND+IDN.W.X.C.M.USD_EXC.N.N
48,341 +79.6% over 1y
Down 3.0% over the past week.
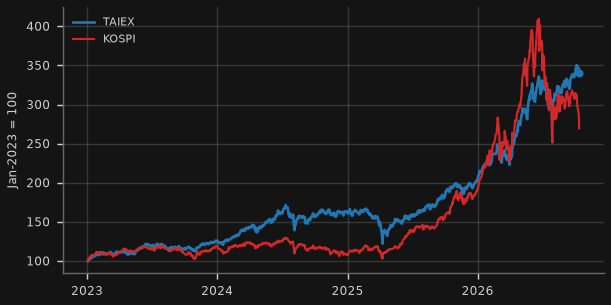
Why it matters for Australia: Taiwan/Korea equities are dominated by chipmakers: the AI/semis cycle drives Asian capex and trade.
Rule, caveat & sources caveat
Rule: TAIEX: stress if >= 20% below 52-week high; heating if 12-month return > +25%; cooling if < -10%; otherwise steady.
Caveat: Proxy for Taiwan exports/semis billings (no free keyless source found). Verified: TAIEX record close 49,822.55 on 2026 7 Oct, about +70-72% YTD; KOSPI about +60-65% YTD.
Source: Yahoo Finance chart endpoint (unofficial): ^TWII, ^KS11
Show 2 more trade & tech cycle chartsHide 2 more trade & tech cycle chartsKorea exports (US$, 3-mo y/y) · OECD business confidence (PMI substitute)
67.5% +17.1pp over 3m
Up 5.1pt on the previous month; highest in the data back to 2013.
Why it matters for Australia: Korea is the canary for Asian trade and the semiconductor cycle.
Rule, caveat & sources caveat
Rule: 3-month sum of USD exports, y/y: heating > +10%; cooling < 0%; otherwise steady.
Caveat: Verified vs MOTIR: Aug-2026 US$98.25bn, +68.7% y/y (semiconductors +209%). Sep-2026 (US$120.9bn, +83.5%) not yet in OECD feed. Customs 10/20-day data not available via free API.
Source: OECD Data Explorer (DSD_IMTS@DF_IMTS): KOR.W.X.C.M.USD_EXC.N.N
99.81 +0.0 over 3m
Unchanged on the previous month.
Why it matters for Australia: Free proxy for regional PMIs: manufacturing confidence across Australia's main customers.
Rule, caveat & sources caveat
Rule: Average of China, Japan, Korea (months all report): heating > 100.5; cooling < 99.5; otherwise steady (100 = long-run average).
Caveat: S&P Global / Caixin PMIs are proprietary. OECD BCI is amplitude-adjusted (100 = long-term average). India's series ends Feb-2026 (excluded).
Source: OECD Data Explorer (DSD_STES@DF_CLI): CHN+JPN+KOR+IDN+AUS+USA.M.BCICP...AA...H
FX, rates & prices
95.7 +1.5% over 3m
Up 0.1% over the past week.
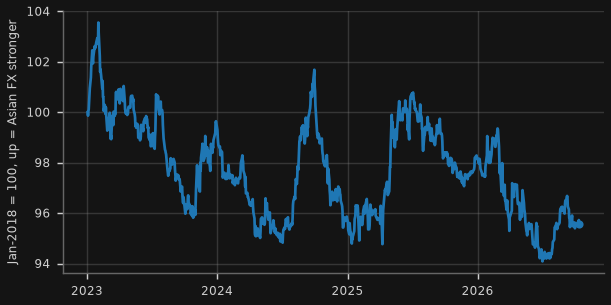
Why it matters for Australia: Asian currency weakness signals dollar funding stress and capital outflow in the region.
Rule, caveat & sources caveat
Rule: 3-month change: stress if Asian FX weakens >= 3%; heating if it strengthens >= 3%; otherwise steady.
Caveat: Built from RBA AUD cross rates (KRW, TWD, INR, IDR, SGD, THB, MYR, PHP); excludes CNY and JPY (own sections).
Source: RBA table F11.1: FXRSKW, FXRNTD, FXRIRE, FXRIR, FXRSD, FXRTB, FXRMR, FXRPHP (crossed with FXRUSD)
3.00% +50bp over 6m
Up 0.2pt over the past week.
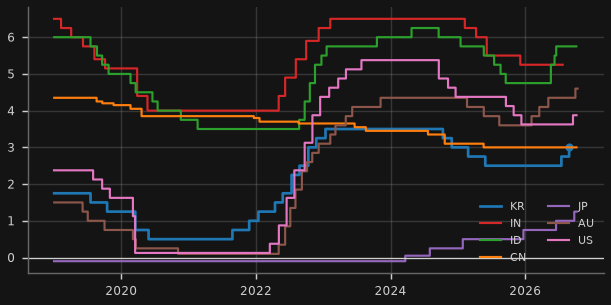
Why it matters for Australia: Regional easing vs tightening shows whether Asia is fighting slowdown or inflation/currency pressure.
Rule, caveat & sources caveat
Rule: Count of the 7 central banks that moved >= 10bp over 6 months: cooling (easing cycle) if cuts exceed hikes by >= 3; heating if hikes exceed cuts by >= 3; otherwise steady.
Caveat: Latest value field shows Korea. BIS series except Australia (RBA F1 cash rate target, fresher than BIS). China as defined by BIS; US = midpoint of target range.
Source: BIS Data Portal (WS_CBPOL): D.KR+IN+ID+CN+JP+US; RBA table F1: FIRMMCRTD
Show 3 more fx, rates & prices chartsHide 3 more fx, rates & prices chartsCPI inflation across Asia (y/y) · 10y government bond yields (monthly avg) · Hang Seng Index
4.4% +1.0pp over 3m
Up 0.06pt on the previous month; highest since Dec 2024.
Why it matters for Australia: Inflation differentials drive where regional rates (and currencies) head.
Rule, caveat & sources caveat
Rule: Context only (no traffic light).
Caveat: Latest value field shows India.
Source: BIS Data Portal (WS_LONG_CPI): M.KR+IN+ID+CN+JP.771
4.45% +160bp over 1y
Up 0.2pt on the previous month; highest in the data back to 2012.
Why it matters for Australia: Australia's 10y now sits above most of Asia: relative yields drive regional demand for AUD bonds.
Rule, caveat & sources caveat
Rule: Context only (no traffic light).
Caveat: Latest value field shows Korea. Indonesia not available in OECD feed.
Source: OECD Data Explorer (DSD_STES@DF_FINMARK): CHN+IND+IDN+JPN+KOR+AUS.M.IRLT.PA.....
Hang Seng IndexCOOLING
24,345 -2.7% over 3m
Up 0.3% over the past week.
Why it matters for Australia: Hong Kong is the offshore market for Chinese risk; its drawdowns mark regional risk-off.
Rule & sources
Rule: Hang Seng: stress if >= 20% below 52-week high; cooling if 10-20% below; heating if within 2% of the 52-week high; otherwise steady.
Source: Yahoo Finance chart endpoint (unofficial): ^HSI
About / sources. A rules-based monitor of the Australian macro and credit cycle from an Asian and US-funding perspective. All data are free public sources: RBA, ABS, BIS, OECD, FRED (St Louis Fed), Federal Reserve Board (H.4.1, GSW yield curve), NY Fed Markets API (reference rates, primary dealer statistics), Japan Ministry of Finance, Cboe index history files, ETF issuer files (State Street, ProShares, Direxion, iShares, Invesco, Roundhill), Fed Financial Accounts (Z.1), Robert Shiller's data, China NBS releases, ASIC, World Bank Pink Sheet, Geopolitical Risk / EPU indices, Yahoo Finance (unofficial chart endpoint). Each card names its series IDs and links to the source; release lags differ by series. Machine-readable latest values: data/latest_summary.csv.
Disclaimer: for information and education only; not financial, investment or tax advice. Data may be revised, delayed or contain errors; check the original source before relying on any figure.