Long-term trends & geopolitics
Last updated: 2026 15 Oct, 09:46 AWST (Perth). Key charts are shown first; tap Show more under a topic for alternative views. All sections & traffic-light overview.
Traffic-light key
HEATING running hot / accelerating / tightening pressure building (e.g. inflation above target, rapid credit growth, rising yields, booming asset prices)
STEADY inside its normal range under the stated rule
COOLING slowing / weakening, or a restrictive setting that is exerting cooling pressure (e.g. high real rates, inverted curve)
STRESS dislocation signal: spreads or insolvencies surging, carry unwind, sharp drawdown, labour-market break (Sahm-style)
INFO context chart only, no traffic-light rule
STEADY inside its normal range under the stated rule
COOLING slowing / weakening, or a restrictive setting that is exerting cooling pressure (e.g. high real rates, inverted curve)
STRESS dislocation signal: spreads or insolvencies surging, carry unwind, sharp drawdown, labour-market break (Sahm-style)
INFO context chart only, no traffic-light rule
Summary from the latest data. The 12 charts on this page give context and carry no traffic-light rules.
Long-term trends 9 charts
Context only (no traffic lights): the longest reliable free history for US and Australian yields and GDP. Where no single series covers the period, sources are spliced; every splice is a dotted vertical line on the chart, named in the card caveat,. Grey shading: NBER recessions (US) or named Australian recessions (no official dating).
Bond yields and policy rates
10y 5.21%, 2y 4.79%, FF 3.88% +1.2pp over 1y
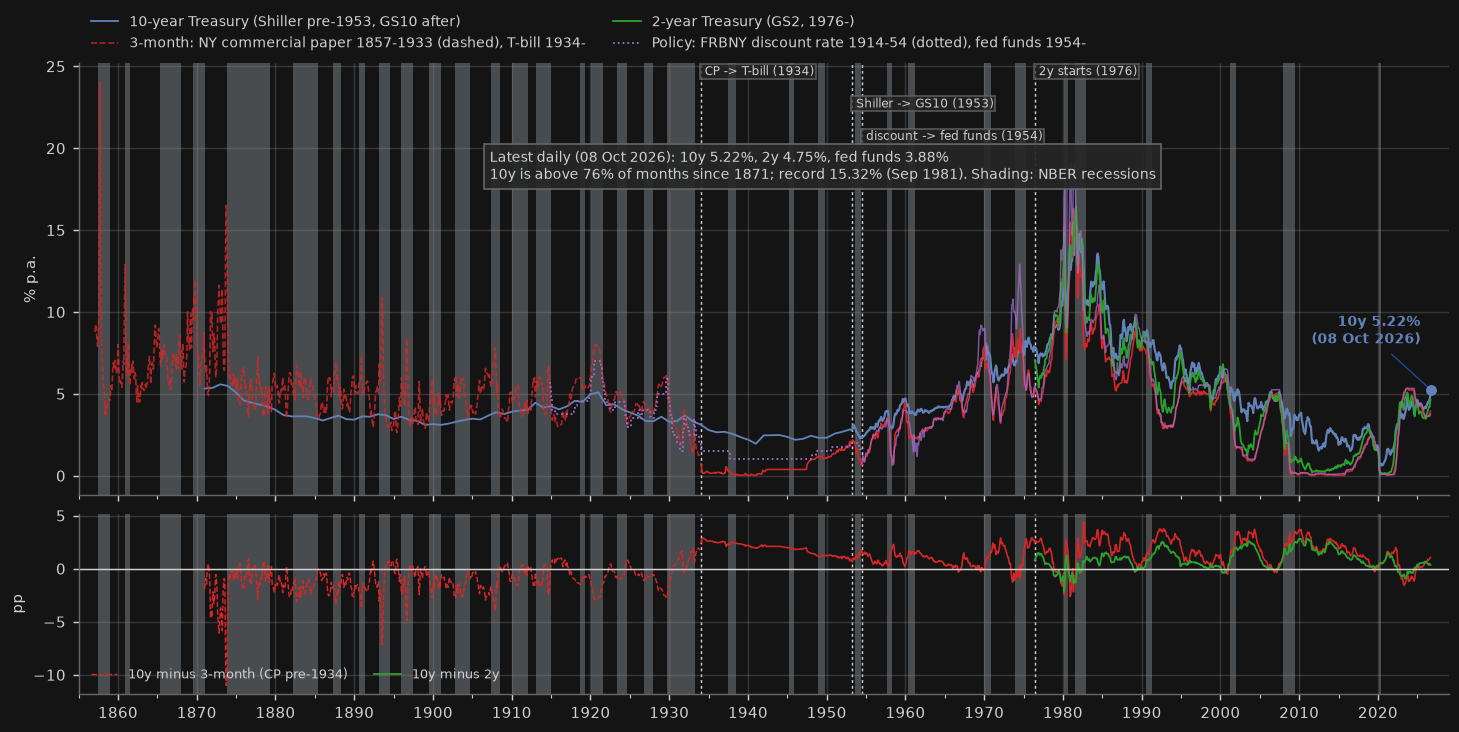
Why it matters for Australia: The US 10-year is the world's benchmark discount rate; long-run context shows whether today's level is unusual or a return to pre-2008 norms, which matters for every leveraged Australian asset priced off global yields.
Rule, caveat & sources caveat
Rule: Context only (no traffic light).
Caveat: Splices (dotted lines): 10y = Shiller long rate (Homer & Sylla-based; pre-1953 values are annual yields interpolated to monthly, not a constant 10-year maturity) to Mar-1953, then GS10. 3-month = NY commercial paper (NBER) to 1933, then T-bill; commercial paper carries a credit premium (~+0.6pp vs bills in the overlap), so pre-1934 front-end and spread levels are not like-for-like. Policy = FRBNY discount rate to Jun-1954, then fed funds. Chart is monthly; headline uses latest daily values.
Source: Robert Shiller, ie_data.xls (shillerdata.com): Long Interest Rate GS10 (col G), CPI (col E); FRED (St Louis Fed): GS10, DGS10; FRED (St Louis Fed): TB3MS; FRED (St Louis Fed): GS2, DGS2; FRED (St Louis Fed): FEDFUNDS, DFF; FRED (St Louis Fed): M13002US35620M156NNBR; FRED (St Louis Fed): M13009USM156NNBR; FRED (St Louis Fed): USREC
10y 5.40%, 3y 4.93%, cash 4.60% +1.0pp over 1y
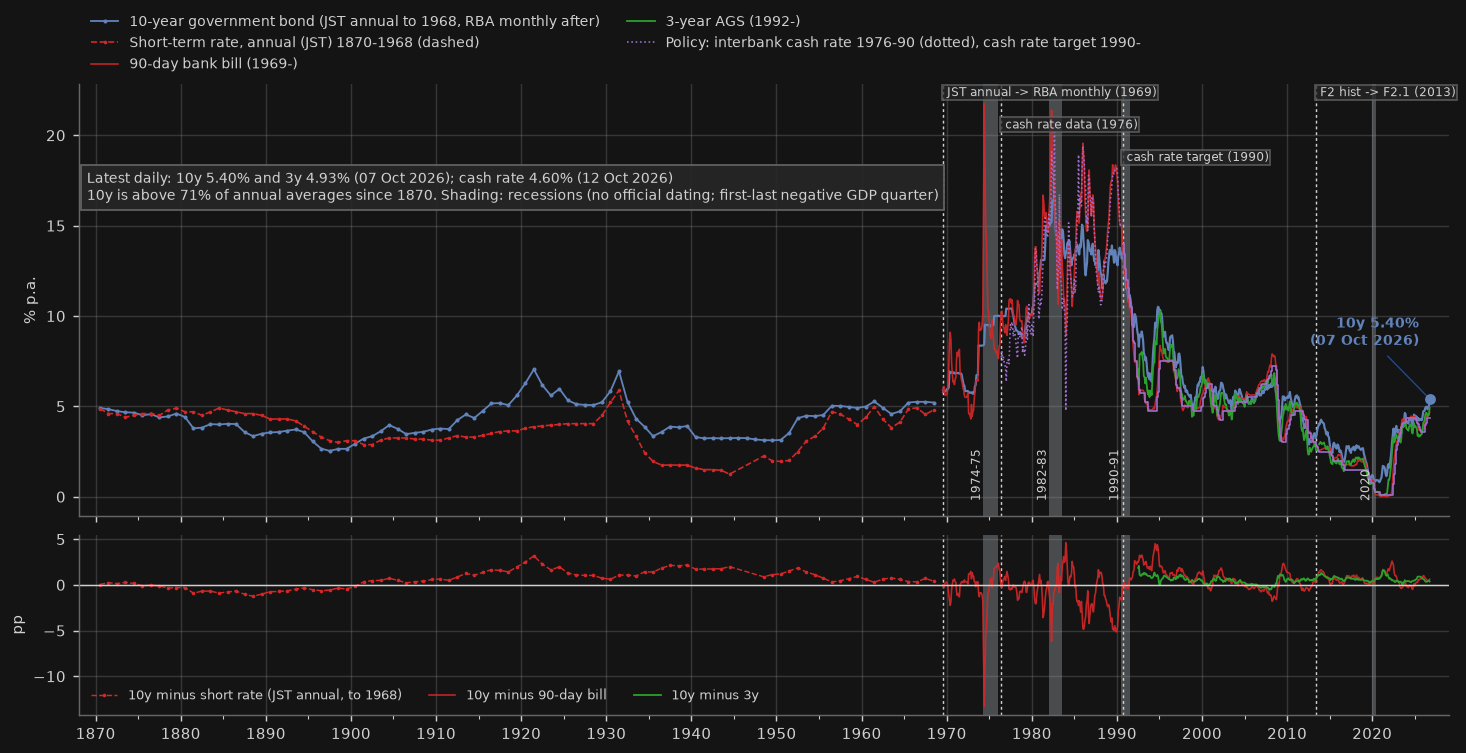
Why it matters for Australia: Australian long rates track US yields plus a premium; the long history shows where today's 10y sits against the high-inflation 1970s-80s and the near-zero 2010s.
Rule, caveat & sources caveat
Rule: Context only (no traffic light).
Caveat: Splices (dotted lines): 10y = JST annual long-term government bond yield 1870-1968 (not a constant 10-year maturity), then RBA monthly 10-year (F2 historical to Apr-2013, F2.1 from May-2013). Front end = JST annual short-term rate to 1968, then 90-day bank bills (different instruments; see README splice table). Recession shading: 1974-75 = Apr 1974-Dec 1975; 1982-83 = Jan 1982-Jun 1983; 1990-91 = Jul 1990-Jun 1991; 2020 = Jan 2020-Jun 2020 (first to last negative quarter of real GDP within each named period; Australia has no official recession dating).
Source: Jorda-Schularick-Taylor Macrohistory Database R6: ltrate, stir, gdp, rgdpmad x pop, cpi; RBA historical table f02histhist: FCMYGBAG10, FCMYGBAG3; RBA table F2.1: FCMYGBAG10, FCMYGBAG3; RBA table F2: FCMYGBAG10D, FCMYGBAG3D; RBA table F1.1: FIRMMBAB90, FIRMMCRI, FIRMMCRT; RBA table F1: FIRMMCRTD; RBA table H1: GGDPCVGDP (recession shading)
Output (GDP)
real +2.2% y/y, nominal +6.3% -0.2pp over 1y
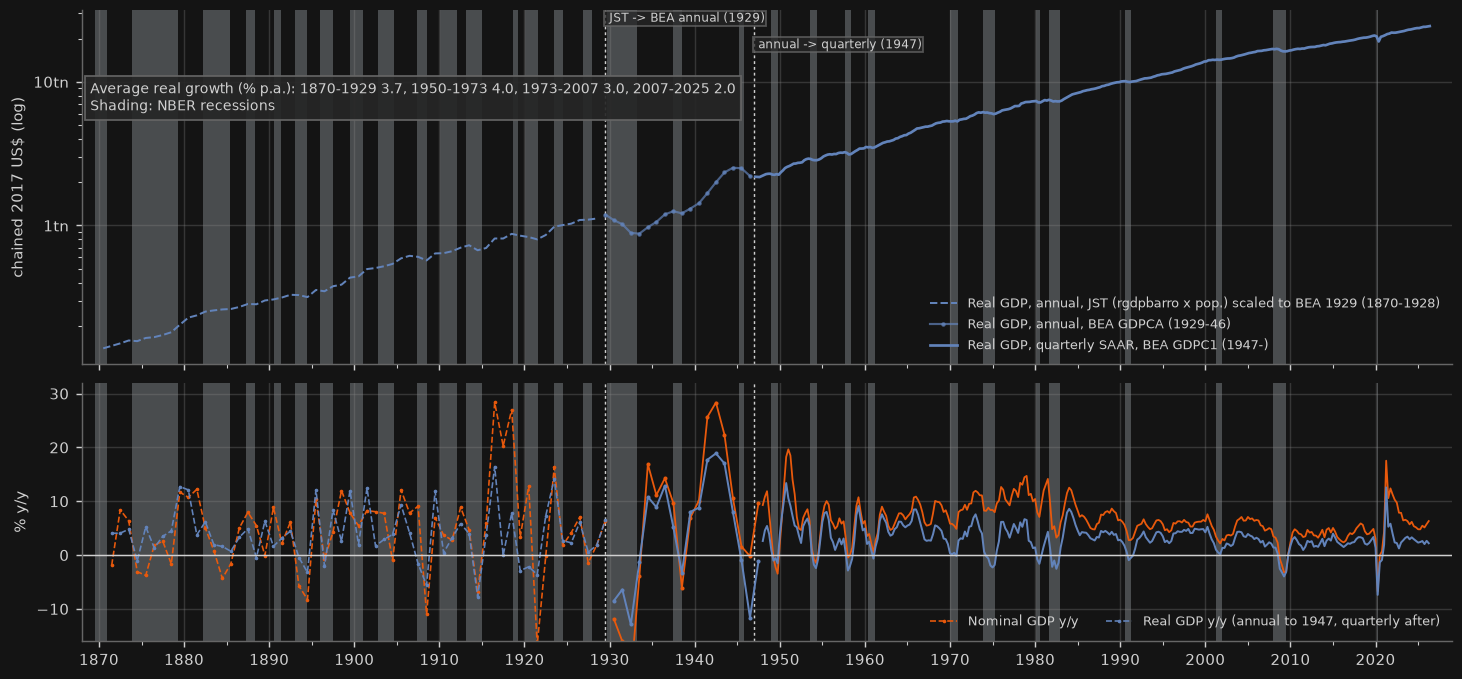
Why it matters for Australia: US nominal growth sets the 'natural' level for long yields and the income that services US debt; the long record shows how unusual (or not) the current expansion is.
Rule, caveat & sources caveat
Rule: Context only (no traffic light).
Caveat: Splices (dotted lines): pre-1929 real GDP = JST real GDP per capita x population (measure chosen by best fit to BEA; see README) ratio-linked to BEA at 1929; 1929-46 BEA annual; quarterly BEA from 1947. Pre-1929 estimates are reconstructions (Maddison/Balke-Gordon type) with wide error bands. Annual growth plotted mid-year.
Source: Jorda-Schularick-Taylor Macrohistory Database R6: ltrate, stir, gdp, rgdpmad x pop, cpi; FRED (St Louis Fed): GDPC1, GDP; FRED (St Louis Fed): GDPCA, GDPA; FRED (St Louis Fed): USREC
real +2.1% y/y, nominal +5.3% +0.2pp over 1y
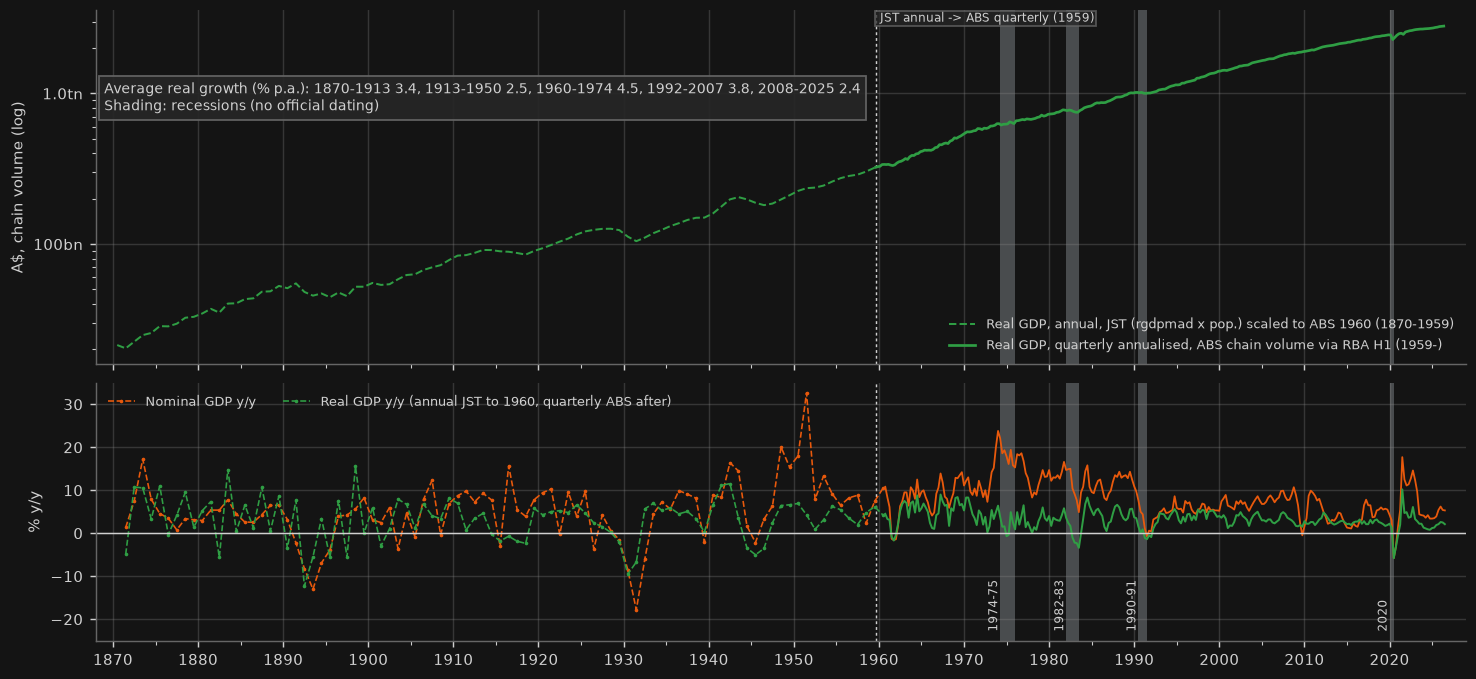
Why it matters for Australia: Nominal GDP growth is the income stream that services Australia's household and business debt; when it runs below borrowing rates, leverage starts to bite.
Rule, caveat & sources caveat
Rule: Context only (no traffic light).
Caveat: Splice (dotted line): JST annual real GDP (per capita x population) 1870-1959 ratio-linked to ABS chain-volume GDP (RBA H1) at 1960; quarterly ABS from Sep-1959. Pre-1959 Australian GDP is a historical reconstruction (Butlin/Haig-based, via Maddison) with wide error bands. JST data end in 2020; they are only used before 1960.
Source: Jorda-Schularick-Taylor Macrohistory Database R6: ltrate, stir, gdp, rgdpmad x pop, cpi; RBA table H1: GGDPCVGDP, GGDPCVGDPY, GGDPECCPGDP, GGDPECCPGDPY
Show 2 more output (gdp) chartsHide 2 more output (gdp) chartsReal GDP trend breaks (segmented log trend), US and Australia · Real GDP per capita trend breaks, US and Australia
Now vs 1983-2007 trend: US -22%, Australia -19% breaks US 1880, 1899, 1932, 1946, 1965, 2009 | AU 1892, 1903, 1915, 1930, 1945, 1969, 1999
Why it matters for Australia: Separates temporary slumps (level returns to the old trend) from permanent losses; a lower trend after 2008 means less income growth to carry debt at today's real rates.
Rule, caveat & sources caveat
Rule: Context only (no traffic light).
Caveat: Bai-Perron-style least-squares breaks in a log-linear trend (each segment has its own level and slope), minimum segment 10 years, number of breaks by the LWZ criterion (BIC picks as many or more). Break-year bands are approximate (profile likelihood; ignore serial correlation, so true uncertainty is wider). Pre-1950 data are annual historical reconstructions (JST/Maddison) with large error bands, spliced to BEA (1929) and ABS (1960); Australian population from JST to 1959 ratio-linked to World Bank from 1960. The US 1880 break reflects 12% growth in both 1879 and 1880 in the historical reconstructions (resumption boom), which are uncertain. Full tables: data/gdp_trend_segments.csv and data/gdp_shock_recovery.csv.
Source: Jorda-Schularick-Taylor Macrohistory Database R6: ltrate, stir, gdp, rgdpmad x pop, cpi; FRED (St Louis Fed): GDPCA, GDPC1, B230RC0A052NBEA, POPTOTAUA647NWDB, USREC; RBA table H1: GGDPCVGDP
Now vs 1983-2007 trend: US -15%, Australia -24% breaks US 1880, 1899, 1932, 1946, 2009 | AU 1892, 1915, 1930, 1945, 2004
Why it matters for Australia: Separates temporary slumps (level returns to the old trend) from permanent losses; a lower trend after 2008 means less income growth to carry debt at today's real rates.
Rule, caveat & sources caveat
Rule: Context only (no traffic light).
Caveat: Bai-Perron-style least-squares breaks in a log-linear trend (each segment has its own level and slope), minimum segment 10 years, number of breaks by the LWZ criterion (BIC picks as many or more). Break-year bands are approximate (profile likelihood; ignore serial correlation, so true uncertainty is wider). Pre-1950 data are annual historical reconstructions (JST/Maddison) with large error bands, spliced to BEA (1929) and ABS (1960); Australian population from JST to 1959 ratio-linked to World Bank from 1960. The US 1880 break reflects 12% growth in both 1879 and 1880 in the historical reconstructions (resumption boom), which are uncertain. Full tables: data/gdp_trend_segments.csv and data/gdp_shock_recovery.csv.
Source: Jorda-Schularick-Taylor Macrohistory Database R6: ltrate, stir, gdp, rgdpmad x pop, cpi; FRED (St Louis Fed): GDPCA, GDPC1, B230RC0A052NBEA, POPTOTAUA647NWDB, USREC; RBA table H1: GGDPCVGDP
Yields vs growth and real yields
US -1.9pp, Australia -0.4pp -1.5pp over 1y
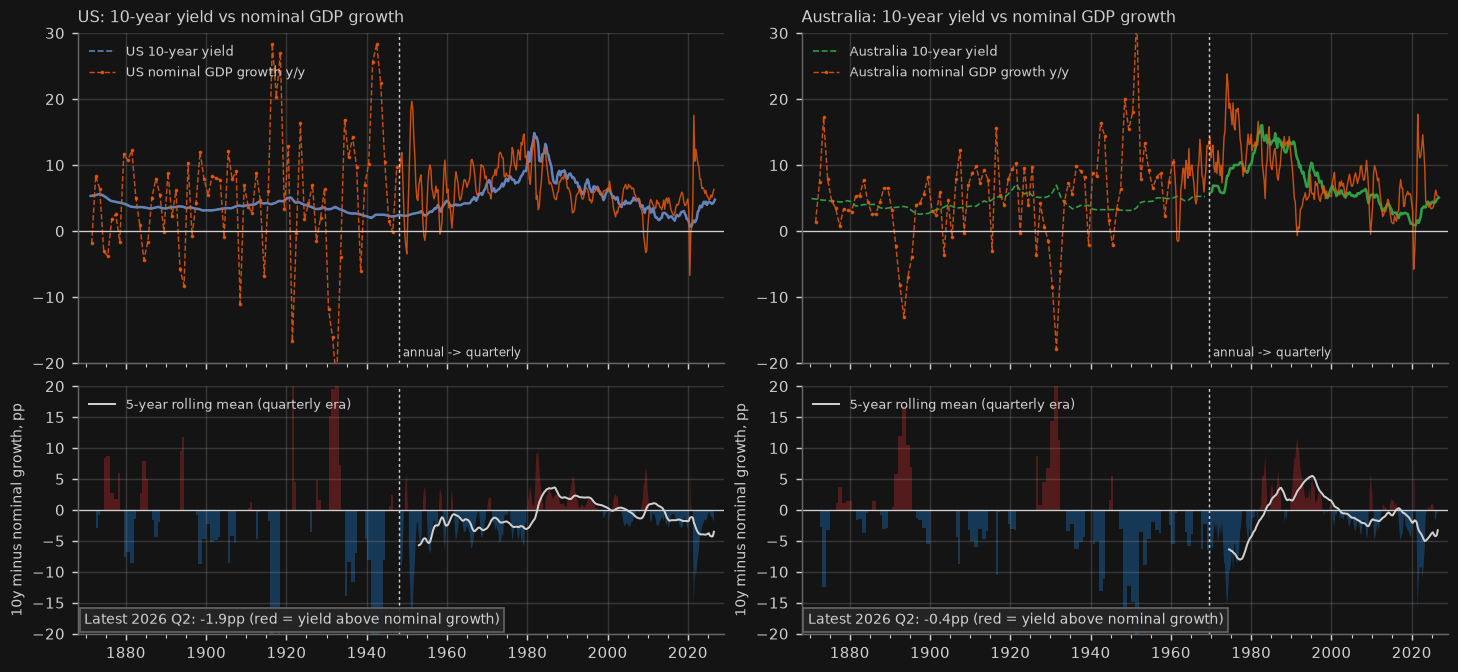
Why it matters for Australia: The thesis test in one chart: when the 10-year yield runs above nominal GDP growth, debt grows faster than the income that services it and leveraged assets come under pressure.
Rule, caveat & sources caveat
Rule: Context only (no traffic light).
Caveat: Gap = 10-year yield minus year-ended nominal GDP growth (annual before 1948 US / 1969 Australia; quarterly after). Uses quarter-average monthly yields, so it lags the latest daily yields. Year-ended growth swings sharply in shocks (2020-21); the 5-year mean shows the regime.
Source: Robert Shiller, ie_data.xls (shillerdata.com): Long Interest Rate GS10 (col G), CPI (col E); FRED (St Louis Fed): GS10, GDP, GDPA; Jorda-Schularick-Taylor Macrohistory Database R6: ltrate, stir, gdp, rgdpmad x pop, cpi; RBA table F2.1: FCMYGBAG10; RBA table H1: GGDPECCPGDPY
US +1.5pp, Australia +1.5pp +0.1pp over 1y
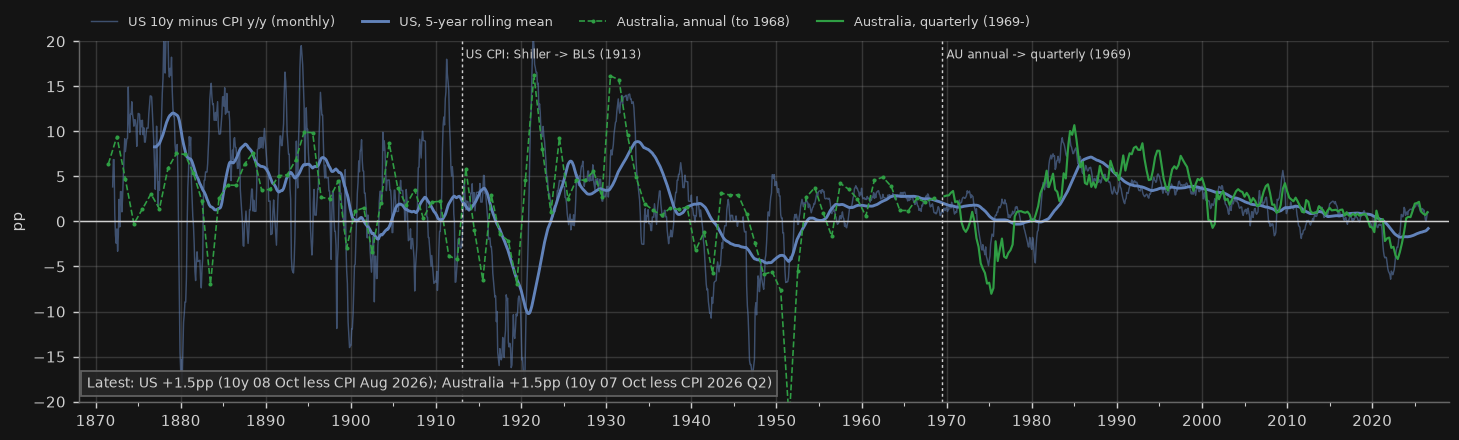
Why it matters for Australia: Your thesis variable over 150 years: sustained positive real long rates (1920s-30s, 1980s-90s) coincided with deleveraging; deeply negative ones (1940s, 1970s, 2021-22) eroded debt.
Rule, caveat & sources caveat
Rule: Context only (no traffic light).
Caveat: Realised (backward-looking) inflation, not expected inflation; for market real yields since 1997/1986 see the TIPS and indexed-bond cards. Australian CPI includes the 2000 GST step. Splices marked by dotted lines.
Source: Robert Shiller, ie_data.xls (shillerdata.com): Long Interest Rate GS10 (col G), CPI (col E); FRED (St Louis Fed): GS10, DGS10, CPIAUCNS; Jorda-Schularick-Taylor Macrohistory Database R6: ltrate, stir, gdp, rgdpmad x pop, cpi; RBA table F2.1: FCMYGBAG10; RBA table G1: GCPIAGYP
Productivity (Australia)
GDP/hour -0.1% vs Dec-19 (-8.8% vs trend); market sector +2.8% -0.2% over 1y
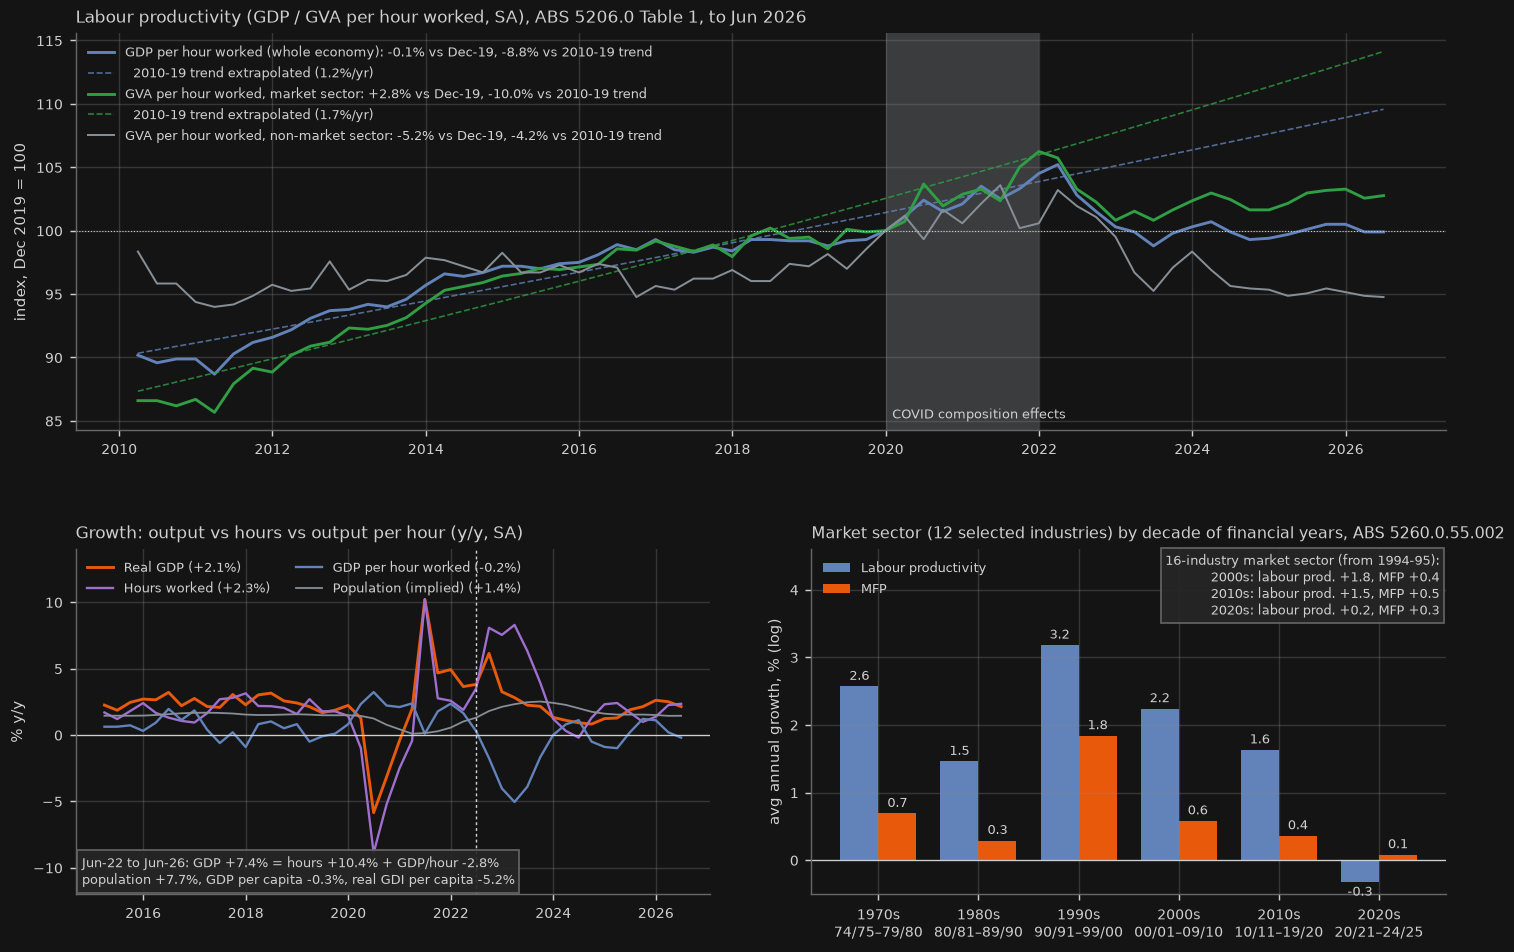
Why it matters for Australia: Productivity is the only lasting source of per-capita income growth; when it stalls, higher real rates have to be serviced from flat real incomes.
Rule, caveat & sources caveat
Rule: Context only (no traffic light).
Caveat: Non-market sector output (health, education, public administration, much of the care economy incl. NDIS) is largely measured by inputs, so its measured productivity is near flat by construction; the shift of hours into these sectors drags whole-economy GDP/hour. 2020-21 levels are inflated by composition (low-paid, low-output hours dropped out in lockdowns), so the post-2021 fall partly unwinds that. MFP data are annual to 2024-25 (released Feb 2026); the 2020s bar covers only 5 years. Implied population = GDP / GDP per capita.
Source: ABS 5206.0 Table 1 (Key aggregates): A2304192L GDP/hour, A3606058X & A130272211T GVA/hour market & non-market, A2304428W hours, A2304402X GDP, A2304404C GDP per capita, A2304410X real GDI (SA); ABS 5260.0.55.002 Industry multifactor productivity: Tables 2-5 (market sector, 12 selected industries); ABS 6345.0 Wage Price Index Table 1: A2713849C (all sectors, SA); RBA table G1: GCPIAG
Geopolitics watch 3 charts
Hand-curated, dated items, each checked against the linked source on 2026 12 Oct. These are qualitative and deliberately not scored; the GPR and EPU charts below are context only. Update geo.py ITEMS when refreshing.
| Date | Theme | What happened | Market channel to Australia/Asia | Source |
|---|---|---|---|---|
| 2026 7–11 Oct | Middle East / energy shipping | Hormuz escalation moved to the bypass route: on 7 Oct Iran said it would close the 'illegal' southern route hugging Oman's coast, and a tanker was hit by 'multiple projectiles' off Qatar (~500km west of the strait). On 9-10 Oct the IRGC said it struck the LPG carrier NV Sunshine on that route, and UKMTO reported a projectile fire on the crude tanker GEM NO2 off the UAE. Trump said on 8 Oct the US will not attack Iran before the 3 Nov midterms. On 11 Oct Iran's security council head called the latest US response 'insufficient'. Brent futures settled US$104.72 on 9 Oct (US$100.20 on 7 Oct). | Brent and oil-linked Asian LNG prices; Australian fuel inflation and so the RBA; LNG export receipts; Asian importers' terms of trade | The Guardian, 2026 8 Oct Asharq Al-Awsat / AFP, 2026 10 Oct |
| 2026 6–8 Oct | Middle East / energy shipping | Strait of Hormuz: tanker attacks hit their highest weekly level since the Iran war began (2026 28 Feb). Only seven commodity vessels transited on 6 Oct (lowest since 23 Jul), and crude through the strait fell to ~10.1 mb/d, 74% of pre-war (Kpler). Gulf exports rerouted via the Gulf of Oman and the Red Sea kept total Middle East crude exports near pre-war levels. | Brent and oil-linked Asian LNG prices; Australian fuel inflation (and so the RBA); LNG export receipts; Asian importers' terms of trade | The National / Reuters, 2026 8 Oct |
| 2026 10 Oct | Fuel security / Russia | Trump announced a deal for Russia to supply 300,000 tons of diesel to the US and global markets immediately, then 500,000 tons in November, rising later to 3m tons. Energy Minister Bowen said Australia does not 'need or want' Russian fuel and will not change its approach. Australia holds 43 days of petrol and 31 days of diesel, with 51 fuel ships en route and 3.2bn litres contracted over the next four weeks. | Global diesel supply and margins; Australian diesel and freight costs (CPI automotive fuel, and so the RBA); mining and farm input costs; friction with US sanctions policy | The Guardian, 2026 10 Oct ABC News, 2026 10 Oct |
| 2026 27 Sep – 5 Oct | US-China trade | After Xi's 24-25 Sep state visit to Washington, the US and China released '30-for-30' Board of Trade lists: reciprocal tariff cuts (mostly to MFN) on ~US$30bn of goods each way. Officials say cuts are not immediate (US Section 301 notice-and-comment first). The Kuala Lumpur tariff truce was extended from 2026 10 Nov to 2027 10 Jan. China's list includes US coal. | CNY, China export growth, iron ore sentiment, AUD; US coal gaining access to China competes with Australian coal | Covington, 2026 5 Oct Caixin, 2026 1 Oct |
| 2026 8 Oct | China-Australia trade (iron ore) | Fortescue's September-quarter update: cash fell 37% to $3.2bn (from $5.1bn) and net debt rose to $2.8bn (from $0.9bn). Shipments were 46.8 Mt (-6% y/y, port maintenance) and sales 42.9 Mt. FY27 shipment, cost and capex guidance is held but 'subject to' negotiations with China's state buyer CMRG, which earlier this year told some mills not to take Fortescue's flagship product. BHP settled its own CMRG standoff in April 2026. | Iron ore pricing power shifting toward Chinese buyers; Pilbara volumes and margins; budget mining receipts; AUD | Mining Weekly / Reuters, 2026 8 Oct |
| 2026 9 Oct | Japan politics / BoJ | The Takaichi cabinet approved and submitted its bill to cut the consumption tax on food and drink from 8% to 1% for two years from April 2027, plus income-linked payments; ~¥10tn of revenue is lost over two years. The government says no deficit-financing bonds will be used but has not named funding sources (Diet session ends 12 Dec). The BoJ (1.25% after June and September hikes) is expected to hold at its 29-30 Oct meeting, and the Fed is expected to hike on 28 Oct (MUMSS view, 5 Oct). | JGB 10y/30y yields and term premium, yen carry (USD/JPY, AUD/JPY), Japanese demand for foreign bonds including AGS | Kyodo News, 2026 9 Oct MUFG/MUMSS Japan Weekly, 2026 5 Oct |
| 2026 5 Oct | Japan-Australia economic security | Treasurer Chalmers and Finance Minister Katayama signed a memorandum in Tokyo setting up an annual Japan-Australia Finance Ministerial Dialogue. It covers sharing information on investment trends and supply chains (including defence industry), energy security and critical minerals. Japan's only similar finance dialogues are with Korea and China (the China one has not met since August 2018). | Japanese capital inflows into Australian resources, energy and infrastructure; LNG supply security for Japan; critical-minerals financing (e.g. Lynas) as a hedge against China's export controls | The Japan Times / Bloomberg, 2026 6 Oct Japan Ministry of Finance, 2026 5 Oct |
| 2026 6–11 Oct | Taiwan Strait | In the 24 hours to 6am on 10 Oct, Taiwan's MND tracked 21 PLA aircraft sorties (13 crossed the median line), 7 PLAN ships and 2 official ships. This followed a 6 Oct 'joint combat readiness patrol' (14 sorties, 9 across the line). After President Lai's 10 Oct National Day address, Beijing's Taiwan Affairs Office called him a 'pragmatic worker for Taiwan independence'. | Risk premium on TAIEX/semis supply chain (TSMC is ~41% of the TAIEX); regional risk-off hits AUD and Asian FX | Taiwan MND, PLA activity 2026 9–10 Oct (Chinese) Taiwan MND press release, 2026 6 Oct People's Daily / Xinhua, 2026 11 Oct |
| 2026 1–9 Oct | South China Sea | USNI counts at least six dangerous Philippine-China encounters since 1 Oct (Scarborough, Second Thomas Shoal, Spratlys), plus a new front in the Luzon Strait near Batanes, where Taiwan's coast guard shadowed a Chinese survey ship and its escort. On 8 Oct China Coast Guard water cannon and blocking delayed a medical evacuation from BRP Sierra Madre at Second Thomas (Ayungin) Shoal by nearly 10 hours. On 9 Oct Philippine forces pushed a Chinese militia vessel and 22 small boats away from Loaita Island. On 3 Oct a J-16 intercepted a Philippine C-208 over Scarborough. | Shipping-lane risk on Australia's northern trade routes; regional defence spending; risk sentiment | USNI News, 2026 9 Oct GMA News, 2026 9 Oct |
| 25 Sep / 2026 6 Oct | AUKUS / defence | On 6 Oct Anduril and the US Navy announced 'Arsenal-2', a $6.6bn submarine-component yard at Sparrows Point, Maryland ($3.7bn of Anduril's own money plus a Navy contract worth up to $2.9bn), adding ~15% to Virginia-class labour capacity. It is meant to ready production by 2030, starting with torpedo tubes. The aim includes meeting AUKUS sales to Australia in the 2030s. Earlier, after a GAO report on idle US attack subs, Rep. Joe Courtney pointed to Australia's US$8.5bn Henderson (WA) repair investment, and Kurt Campbell warned some at the Pentagon would 'love a stumble' (25 Sep). | AUKUS delivery risk and federal defence spending/fiscal position; WA construction demand; alliance / US-China risk premium | USNI News, 2026 6 Oct Crikey, 2026 25 Sep |
| 14 Mar / 2026 13 Apr | Critical minerals | US-Australia critical minerals framework (signed Oct 2025): at the 2026 14 Mar Tokyo ministerial, each side said it had provided at least US$1bn of financing within 6 months, with support for 11 named projects (Australia $1.4bn, US $2.2bn) and a new Critical Minerals Supply Security Response Group. China's Oct-2025 rare-earth controls remain suspended under the truce now extended to 2027 10 Jan. | ASX rare-earth/critical-mineral miners; China's rare-earth leverage; foreign capital inflow to the resources sector | DISR (Australian Govt), 2026 13 Apr |
| 2026 15 Jul | Iron ore supply (Simandou) | Rio Tinto: SimFer (Simandou) mine construction and port infrastructure more than three-quarters complete; full rail commissioning achieved in Q1 2026. 2026 Simandou sales guidance is 5-10 Mt (100% basis). Pilbara Q2 sales were up 7% y/y. | Medium-term iron ore supply and price (Australia's largest export), Pilbara market share, budget mining receipts | Rio Tinto Q2 2026 production results, 2026 15 Jul |
Quantitative proxies (context only)
146 +17.8% over 1y
Up 16.4% on the previous month.
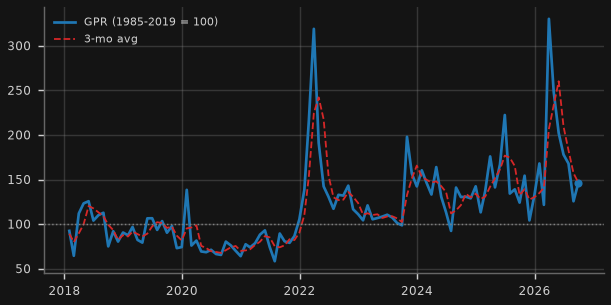
Why it matters for Australia: Spikes in geopolitical risk tend to lift oil and gold and weigh on the AUD and Asian risk assets.
Rule, caveat & sources caveat
Rule: Context only (no traffic light).
Caveat: Newspaper-text index; levels are relative to the 1985-2019 average (=100). No traffic light by design.
Source: Caldara & Iacoviello GPR index: GPR (monthly)
Global 282, US 178, China 239, Japan 97, Korea 395, Australia 244 -33.5% over 1y
Down 10.6% on the previous month; lowest since Dec 2024.
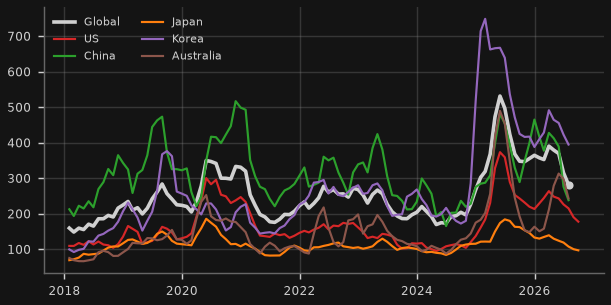
Why it matters for Australia: Policy uncertainty (tariffs, fiscal, elections) delays investment and hiring across the region.
Rule, caveat & sources caveat
Rule: Context only (no traffic light).
Caveat: Latest value field shows Global (GDP-weighted, current prices). Country indices end on different months (Global Jul 2026, US Sep 2026, China Jul 2026, Japan Sep 2026, Korea Jul 2026, Australia Jul 2026). FRED's China/Japan EPU copies are stale and not used.
Source: Baker, Bloom & Davis EPU (policyuncertainty.com): All_Country_Data.xlsx: GEPU_current, US, China, Japan, Korea, Australia; Japan_Policy_Uncertainty_Data.xlsx; FRED (St Louis Fed): USEPUINDXM
Show 1 more quantitative proxies (context only) chartHide 1 more quantitative proxies (context only) chartCountry geopolitical risk shares (3-mo avg)
China 1.12, Taiwan 0.19, Japan 0.28, Korea 0.33, Australia 0.14 +0.2 over 1y
Up 0.1pt on the previous month.
Why it matters for Australia: Shows which Asian flashpoints dominate the risk news flow that markets trade on.
Rule, caveat & sources caveat
Rule: Context only (no traffic light).
Caveat: Share of newspaper articles mentioning geopolitical risk and the country; latest value field shows China.
Source: Caldara & Iacoviello GPR index: GPRC_CHN, GPRC_TWN, GPRC_JPN, GPRC_KOR, GPRC_AUS
About / sources. A rules-based monitor of the Australian macro and credit cycle from an Asian and US-funding perspective. All data are free public sources: RBA, ABS, BIS, OECD, FRED (St Louis Fed), Federal Reserve Board (H.4.1, GSW yield curve), NY Fed Markets API (reference rates, primary dealer statistics), Japan Ministry of Finance, Cboe index history files, ETF issuer files (State Street, ProShares, Direxion, iShares, Invesco, Roundhill), Fed Financial Accounts (Z.1), Robert Shiller's data, China NBS releases, ASIC, World Bank Pink Sheet, Geopolitical Risk / EPU indices, Yahoo Finance (unofficial chart endpoint). Each card names its series IDs and links to the source; release lags differ by series. Machine-readable latest values: data/latest_summary.csv.
Disclaimer: for information and education only; not financial, investment or tax advice. Data may be revised, delayed or contain errors; check the original source before relying on any figure.