Australia: economy, prices, rates & RBA chart pack
Last updated: 2026 15 Oct, 09:46 AWST (Perth). Key charts are shown first; tap Show more under a topic for alternative views. All sections & traffic-light overview.
Traffic-light key
HEATING running hot / accelerating / tightening pressure building (e.g. inflation above target, rapid credit growth, rising yields, booming asset prices)
STEADY inside its normal range under the stated rule
COOLING slowing / weakening, or a restrictive setting that is exerting cooling pressure (e.g. high real rates, inverted curve)
STRESS dislocation signal: spreads or insolvencies surging, carry unwind, sharp drawdown, labour-market break (Sahm-style)
INFO context chart only, no traffic-light rule
STEADY inside its normal range under the stated rule
COOLING slowing / weakening, or a restrictive setting that is exerting cooling pressure (e.g. high real rates, inverted curve)
STRESS dislocation signal: spreads or insolvencies surging, carry unwind, sharp drawdown, labour-market break (Sahm-style)
INFO context chart only, no traffic-light rule
Summary from the latest data. Of the 48 rule-based indicators on this page, 10 are running hot, 25 are steady, 11 are cooling and 2 are flashing stress. The stress readings are in Listed private-credit trusts: price vs NTA and ASX 200 A-REITs. The hot readings include Trimmed mean CPI, Headline CPI, AGS 3y & 10y yields and 7 others. In the latest data, Current account & trade balance is at its lowest since Q2 2016, and Business lending rates by firm size is at its highest since the data begin in 2019.
Australia: economy, prices & rates 48 charts
10heating 23steady 9cooling 2stress
Labour market
Unemployment rateCOOLING
4.6% +0.4pp over 1y
Up 0.1pt on the previous month; highest since Nov 2021.
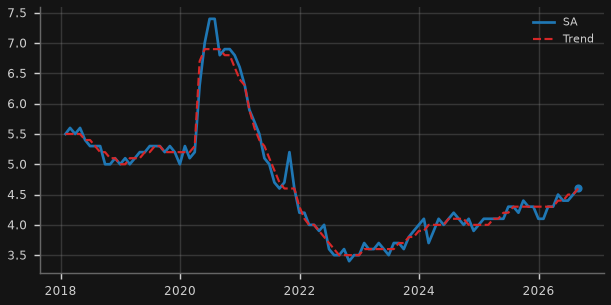
Why it matters for Australia: The single best real-time read on whether high real rates are cracking household cash flow (and mortgage arrears).
Rule & sources
Rule: Stress if 3-mo avg >= 0.5pp above its low of the prior 12 months (Sahm-style); else cooling if 3-mo avg up >= 0.2pp y/y; heating if down >= 0.2pp y/y; otherwise steady.
Source: RBA table H5: GLFSURSA, GLFSURTR
6.2% +0.5pp over 1y
Down 0.1pt on the previous month.
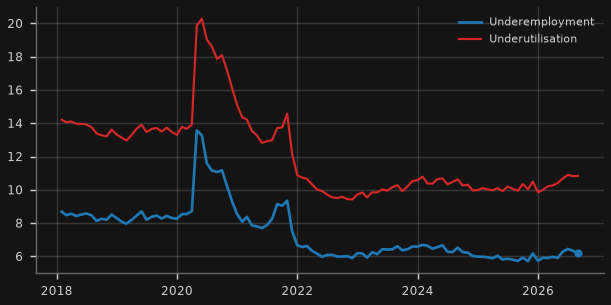
Why it matters for Australia: Spare capacity beyond the headline rate: hours slack shows up before job losses.
Rule & sources
Rule: Cooling if underemployment rate up >= 0.3pp y/y; heating if down >= 0.3pp; otherwise steady.
Source: ABS Data API (LF_UNDER,1.0.1): M23+M24.3.1599.20.AUS.M
1.0% -0.3pp over 1y
Down 0.1pt on the previous month.
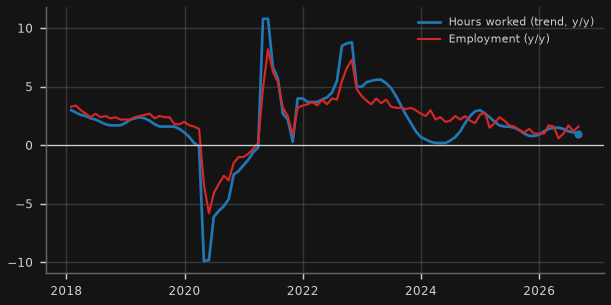
Why it matters for Australia: Hours are the volume of labour actually used; falling hours with steady jobs is an early slowdown sign.
Rule & sources
Rule: Trend hours y/y: heating > 2.5%; cooling < 0.5%; otherwise steady.
Source: RBA table H5: GLFMHWTRYP, GLFSEPTSYP
Show 5 more labour market chartsHide 5 more labour market chartsYouth (15-24) unemployment rate · Employment-to-population ratio · Job vacancies ('000) · Wage Price Index (y/y) · Unit labour costs & productivity (y/y)
10.8% +1.1pp over 1y
Up 0.4pt on the previous month.
Why it matters for Australia: Youth jobs are the marginal hire: they turn first when firms freeze hiring.
Rule, caveat & sources caveat
Rule: Cooling if up >= 1pp y/y; heating if down >= 1pp y/y; otherwise steady.
Caveat: Noisy monthly series (small sample).
Source: ABS Data API (LF_UNDER,1.0.1): M13.3.1524.20.AUS.M
63.9% -0.1pp over 1y
Unchanged on the previous month.
Why it matters for Australia: Captures jobs relative to a fast-growing population (avoids flattering by migration).
Rule & sources
Rule: Cooling if down >= 0.3pp y/y; heating if up >= 0.3pp y/y; otherwise steady.
Source: RBA table H5: GLFSEPTPOP, GLFSPRSA
Job vacancies ('000)STEADY
325 '000 -1.4% over 1y
Down 0.9% on the previous quarter.
Why it matters for Australia: Labour demand: vacancies fall before unemployment rises.
Rule, caveat & sources caveat
Rule: Vacancies y/y: heating > +10%; cooling < -10%; otherwise steady.
Caveat: ABS Job Vacancies survey; quarterly, dated to the middle month of the quarter.
Source: RBA table H5: GLFOSVT, GLFOSVTLF
Wage Price Index (y/y)STEADY
3.2% -0.2pp over 1y
Unchanged on the previous quarter.
Why it matters for Australia: Wage growth vs mortgage rates determines whether borrowers' real debt burden is easing.
Rule & sources
Rule: Heating > 3.5%; cooling < 2.5%; otherwise steady (RBA consistent range roughly 3-3.5%).
Source: RBA table H4: GWPIYP, GWPIPRIYP
3.5% -1.2pp over 1y
Up 0.2pt on the previous quarter.
Why it matters for Australia: Weak productivity keeps unit labour costs (and so core inflation) sticky, which keeps real rates high.
Rule & sources
Rule: Non-farm ULC y/y: heating > 4%; cooling < 2%; otherwise steady.
Source: RBA table H4: GNFULCYP, GNFPROSQP
Inflation
Trimmed mean CPI (y/y)HEATING
3.6% +0.1pp over 3m
Unchanged on the previous month.
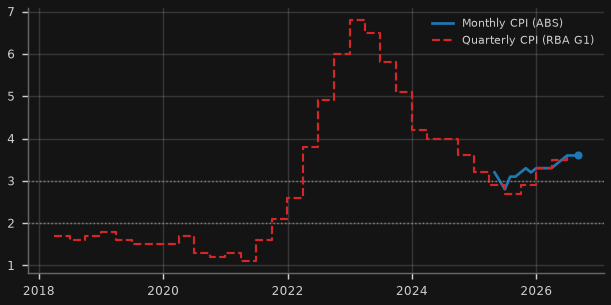
Why it matters for Australia: Core inflation sets the RBA path and hence the real cash rate borrowers face.
Rule, caveat & sources caveat
Rule: Heating > 3%; cooling < 2%; otherwise steady (RBA target band 2-3%).
Caveat: ABS complete monthly CPI only starts Apr-2025; longer history uses the quarterly series (not spliced).
Source: ABS Data API (CPI,2.0.0): 3.{999902|10001}.{20|10}.50.M; RBA table G1: GCPIOCPMTMYP
Headline CPI (y/y)HEATING
4.0% +0.0pp over 3m
Up 0.5pt on the previous month.
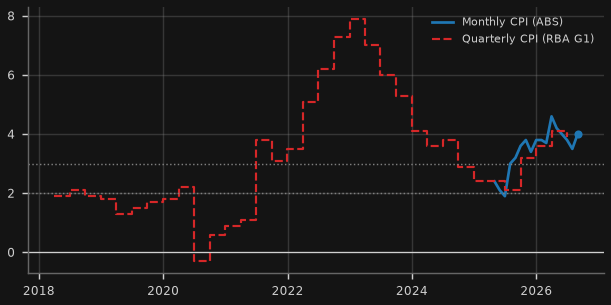
Why it matters for Australia: Headline drives inflation expectations and indexation of rents/wages.
Rule, caveat & sources caveat
Rule: Heating > 3%; cooling < 2%; otherwise steady.
Caveat: Electricity rebates distort headline in 2024-26.
Source: ABS Data API (CPI,2.0.0): 3.{999902|10001}.{20|10}.50.M; RBA table G1: GCPIAGYP
Show 3 more inflation chartsHide 3 more inflation chartsServices vs goods inflation (y/y) · Rents, insurance & electricity (y/y) · Consumer inflation expectations (1y ahead)
3.7% +0.0pp over 3m
Unchanged on the previous month.
Why it matters for Australia: Services inflation is domestic and labour-driven: the part the RBA can't import away.
Rule & sources
Rule: Services y/y: heating > 4%; cooling < 2.5%; otherwise steady.
Source: ABS Data API (CPI,2.0.0): 3.104104+104101.10.50.M; RBA table G1: GCPINTIYP, GCPITIYP
3.6% +0.0pp over 3m
Unchanged on the previous month.
Why it matters for Australia: Rents feed directly from housing undersupply; insurance and power are the cost-of-living pinch points.
Rule, caveat & sources caveat
Rule: Rents y/y: heating > 5%; cooling < 2%; otherwise steady.
Caveat: Electricity y/y heavily affected by government rebate timing.
Source: ABS Data API (CPI,2.0.0): 3.115522+115528+40055.10.50.M
4.9% +0.2pp over 1y
Down 0.6pt on the previous quarter.
Why it matters for Australia: Elevated expectations make the RBA slower to cut, keeping real rates high.
Rule, caveat & sources caveat
Rule: Heating > 5%; cooling < 3.5%; otherwise steady.
Caveat: Melbourne Institute survey; median-based, structurally above actual inflation.
Source: RBA table G3: GCONEXP
Rates, credit & funding
Cash 4.60% (2026 14 Oct) +0.2pp over 1y
Unchanged on the previous month.
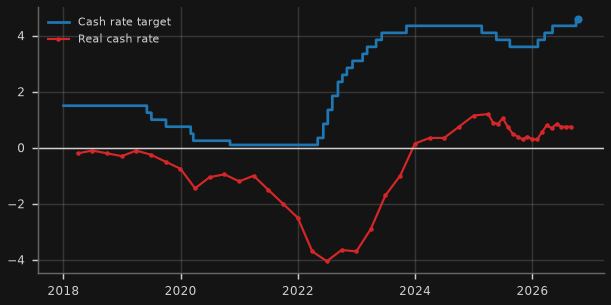
Why it matters for Australia: Core of the thesis: a positive real cash rate is what squeezes credit-financed assets.
Rule, caveat & sources caveat
Rule: Real cash rate (cash target minus latest trimmed-mean y/y): cooling (restrictive) if > 1pp; heating (stimulatory) if < 0; otherwise steady.
Caveat: Real rate uses quarterly trimmed mean before Apr-2025 and monthly after; points only where inflation is observed (no interpolation).
Source: RBA table F1: FIRMMCRTD; RBA table G1: GCPIOCPMTMYP; ABS Data API (CPI,2.0.0): 3.999902.20.50.M
AGS 3y & 10y yieldsHEATING
4.93% +51bp over 3m
Up 0.01pt over the past week.
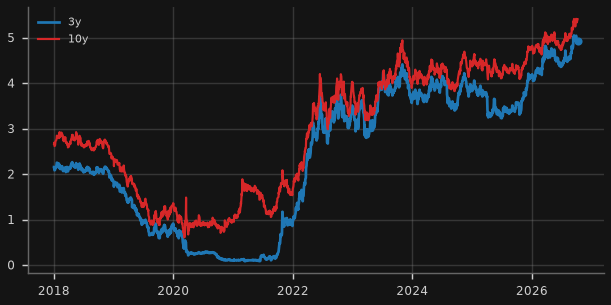
Why it matters for Australia: The 3y prices the RBA path (and fixed mortgage rates); the 10y links Australia to global term premia.
Rule & sources
Rule: 3y yield 3-month change: heating if >= +40bp (market pricing tighter policy); cooling if <= -40bp; otherwise steady.
Source: RBA table F2: FCMYGBAG3D, FCMYGBAG10D
+0.18 pp +6bp over 3m
Up 0.01pt over the past week.
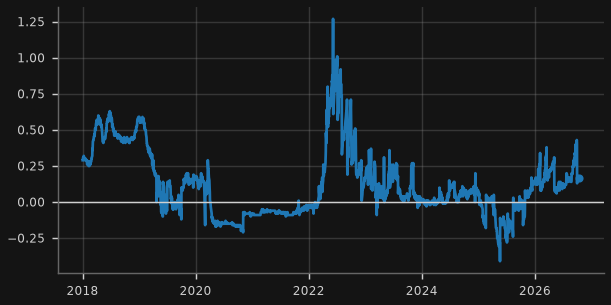
Why it matters for Australia: Bank funding pressure passes straight into business and non-bank lending rates.
Rule, caveat & sources caveat
Rule: Stress if > 0.40pp; cooling (market pricing cuts) if < -0.20pp; otherwise steady.
Caveat: Proxy for BBSW-OIS: RBA stopped publishing OIS rates in Dec-2022, so the spread also embeds expected cash-rate moves over 3 months.
Source: RBA table F1: FIRMMBAB90D, FIRMMCRTD
Housing credit growth (y/y)COOLING
7.3% +1.2pp over 1y
Down 0.2pt on the previous month.
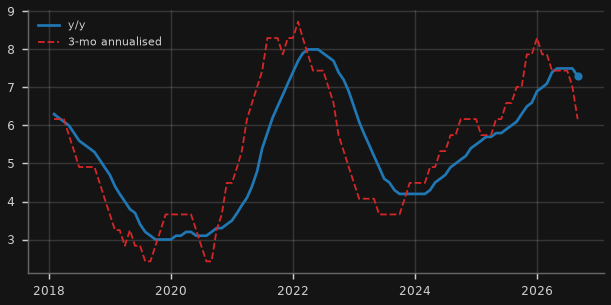
Why it matters for Australia: Housing credit is ~60% of private credit: its pace is the pulse of the leveraged-household thesis.
Rule, caveat & sources caveat
Rule: Heating if y/y > 10% or 3-mo annualised growth exceeds y/y by > 1pp (accelerating); cooling if 3-mo annualised is > 1pp below y/y (decelerating); otherwise steady.
Caveat: RBA D1 growth rates are break-adjusted.
Source: RBA table D1: DGFACH12, DGFACHM
Show 9 more rates, credit & funding chartsHide 9 more rates, credit & funding chartsAGS 10y-3y curve · AGS indexed bond (real) yield · BBB corporate spread to AGS (5y) · Investor housing credit growth (y/y) · Business credit growth (y/y) · Mortgage rates (variable) · Business credit: where the last 12m went (A$bn) · New housing loan commitments (A$bn/qtr) · Non-ADI (non-bank) share of new housing loans
AGS 10y-3y curveSTEADY
+0.47 pp +4bp over 3m
Up 0.05pt over the past week.
Why it matters for Australia: An inverted curve says markets expect policy to be cut as growth weakens.
Rule & sources
Rule: Cooling if inverted (< 0); heating if > 1.25pp (steep, reflationary); otherwise steady.
Source: RBA table F2: FCMYGBAG3D, FCMYGBAG10D
3.00% +48bp over 3m
Up 0.06pt over the past week.
Why it matters for Australia: Real long rates discount every asset: high real yields pressure property and leveraged valuations.
Rule, caveat & sources caveat
Rule: Cooling (restrictive) if > 2%; heating if < 1%; otherwise steady.
Caveat: RBA 'indexed bond' series (approx. 10y target tenor).
Source: RBA table F2: FCMYGBAGID
1.09 pp +14bp over 3m
Up 0.06pt on the previous month.
Why it matters for Australia: Corporate credit spreads show whether investors are demanding more to lend to Australian business.
Rule, caveat & sources caveat
Rule: Percentile of trailing 10 years: stress >= 90th; cooling 70-90th (credit tightening); heating <= 20th (very tight spreads = easy credit); otherwise steady.
Caveat: Spread computed by subtracting monthly 5y AGS yield from RBA BBB non-financial corporate 5y yield.
Source: RBA table F3: FNFYBBB5M; RBA table F2.1: FCMYGBAG5
9.6% +2.6pp over 1y
Down 0.5pt on the previous month.
Why it matters for Australia: Investor credit is the speculative, rate-sensitive margin of the housing market.
Rule, caveat & sources caveat
Rule: Heating if y/y > 10% or 3-mo annualised growth exceeds y/y by > 1pp (accelerating); cooling if 3-mo annualised is > 1pp below y/y (decelerating); otherwise steady.
Caveat: RBA D1 growth rates are break-adjusted.
Source: RBA table D1: DGFACIH12, DGFACIHM
Business credit growth (y/y)HEATING
10.9% +1.1pp over 1y
Up 0.3pt on the previous month.
Why it matters for Australia: Business credit includes lending to non-bank lenders and property; fast growth late in a cycle is a risk flag.
Rule, caveat & sources caveat
Rule: Heating if y/y > 10% or 3-mo annualised growth exceeds y/y by > 1pp (accelerating); cooling if 3-mo annualised is > 1pp below y/y (decelerating); otherwise steady.
Caveat: RBA D1 growth rates are break-adjusted.
Source: RBA table D1: DGFACBNF12, DGFACBNFM
6.20% +70bp over 1y
Unchanged on the previous month.
Why it matters for Australia: Mortgage rate minus core inflation = the real burden on the household balance sheet.
Rule & sources
Rule: Real mortgage rate (outstanding owner-occupier variable minus trimmed-mean y/y): cooling (restrictive) if > 3pp; heating if < 1pp; otherwise steady.
Source: RBA table F6: FLRHOOVA, FLRHOFVA, FLRHIOVA
Total business finance 11.9% y/y +1.5pp over 1y
Why it matters for Australia: Shows whether new business credit funds productive capacity or property/financial intermediaries (incl. private credit funds).
Rule, caveat & sources caveat
Rule: Context only (no traffic light).
Caveat: RBA D14.1 is NSA and not break-adjusted; 'Financial & insurance' includes lending to non-bank financiers/funds.
Source: RBA table D14.1: industry series (via ../credit-growth-au); RBA table D14: DLBOST+DLBOMT+DLBOLT
97.6 A$bn +6.8% over 1y
Down 5.2% on the previous quarter.
Why it matters for Australia: New lending is the flow that sets house prices at the margin.
Rule, caveat & sources caveat
Rule: Total value y/y: heating > +10%; cooling < -10%; otherwise steady.
Caveat: Total dwellings excluding refinancing; seasonally adjusted; ABS publishes this series quarterly.
Source: ABS Data API (LEND_HOUSING): FIN_VAL.NEWCOMMITS.*.TOTDWELL.TOT.TOT+DV5167+DV5168.20.AUS.Q
10.7% +3.8pp over 1y
Up 0.9pt on the previous quarter; highest in the data back to 2019.
Why it matters for Australia: Rising non-bank share means more housing risk sits outside APRA's prudential perimeter.
Rule, caveat & sources caveat
Rule: Heating if share up >= 1pp y/y (non-bank lending gaining share); cooling if down >= 1pp; otherwise steady.
Caveat: Seasonally adjusted values, dwellings excluding refinancing; ABS non-ADI coverage is registered financial corporations reporting to APRA, not all private credit.
Source: ABS Data API (LEND_HOUSING): FIN_VAL.NEWCOMMITS.*.TOTDWELL.NON_ADI+TOT.TOT.20.AUS.Q
Housing
6.8% -3.2pp over 3m
Down 3.2pt on the previous quarter.
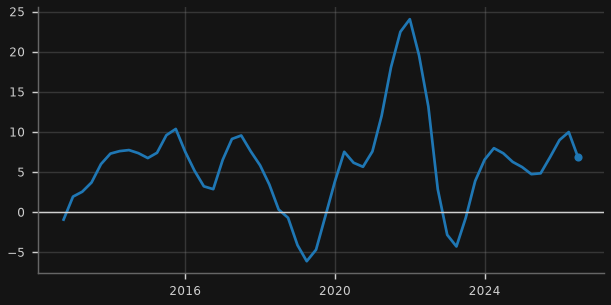
Why it matters for Australia: Housing is the dominant collateral in the Australian credit system.
Rule, caveat & sources caveat
Rule: Heating > 7% y/y; steady 0-7%; cooling -5% to 0; stress < -5%.
Caveat: ABS quarterly with ~3-month lag; monthly Cotality index is not free (see au_housing_outlook.md for its latest prints).
Source: ABS Data API (RES_DWELL_ST,1.0.0): 5.AUS (mean price $'000)
17.9 '000 +4.7% over 6m
Down 0.6% on the previous month.
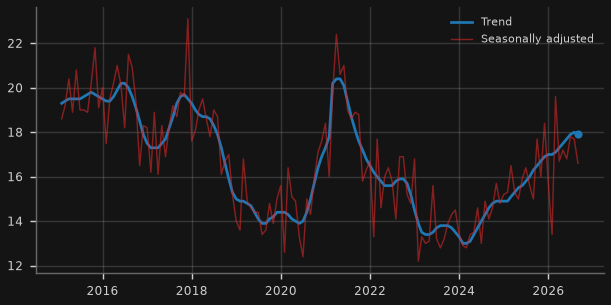
Why it matters for Australia: Approvals lead construction activity and the developer finance pipeline (where private credit is exposed).
Rule & sources
Rule: Trend, 6-month change: heating > +5%; cooling < -5%; otherwise steady.
Source: RBA table H3: GISPSDA, GISDWPRITR
Show 1 more housing chartHide 1 more housing chartDwelling commencements & completions ('000, 4-qtr sum)
204 '000 +13.2% over 1y
Up 3.3% on the previous quarter; highest since Q2 2022.
Why it matters for Australia: Supply response: weak starts keep rents/prices firm but signal developer stress.
Rule, caveat & sources caveat
Rule: Commencements 4-qtr sum y/y: heating > +5%; cooling < -5%; otherwise steady.
Caveat: Total residential, total sectors; ABS quarterly with ~3-month lag. Under construction is original series.
Source: ABS Data API (BUILDING_ACTIVITY): M6+M7+M8.AUS..TOT/1.9.100.{20|10}.Q
Activity & stress
6.8% +2.1pp over 1y
Down 0.2pt on the previous month.
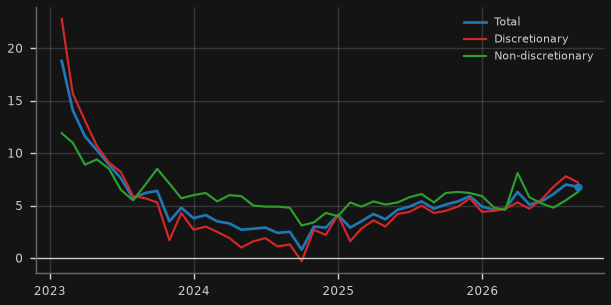
Why it matters for Australia: Consumption is ~half of GDP; discretionary spending is where rate pain shows first.
Rule, caveat & sources caveat
Rule: Approx. real growth (HSI y/y minus monthly CPI y/y): heating > 3%; cooling < 0.5%; otherwise steady.
Caveat: Nominal; real approximation subtracts headline monthly CPI (crude deflator).
Source: ABS Data API (HSI_M,1.6.0): 9.TOT+3+4.CUR.20.AUS.M
0.7% +0.3pp over 1y
Down 0.3pt on the previous quarter.
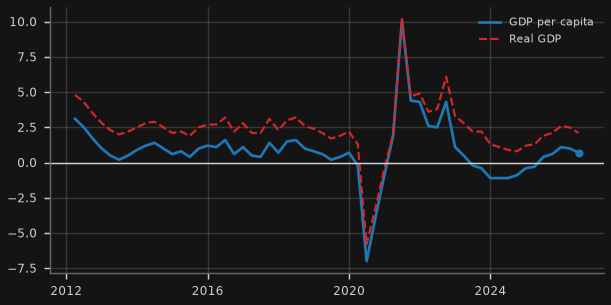
Why it matters for Australia: Per-capita GDP strips out population growth: the 'per-capita recession' test.
Rule & sources
Rule: GDP per capita y/y: cooling < 0%; heating > 2%; otherwise steady.
Source: RBA table H1: GGDPCVGDPY, GGDPCVGDPFY
NAB business conditionsCOOLING
-4.0 net bal. -3.8 over 3m
Up +0.3 net bal. on the previous month.
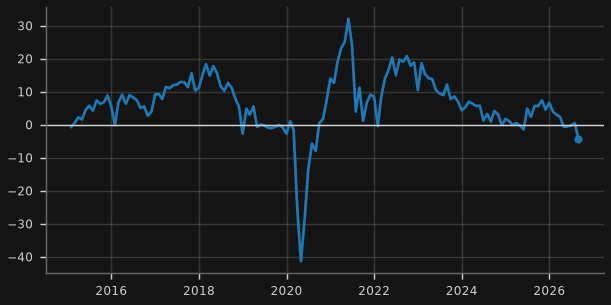
Why it matters for Australia: Business conditions lead hiring and investment.
Show 3 more activity & stress chartsHide 3 more activity & stress chartsHousehold saving ratio · Westpac-MI consumer sentiment · Companies entering external administration (ASIC Series 1)
Household saving ratioSTEADY
6.5% +0.6pp over 1y
Up 0.1pt on the previous quarter.
Why it matters for Australia: A thin saving buffer leaves households less able to absorb high rates; a jump signals precautionary retrenchment.
Rule & sources
Rule: Cooling if up >= 1pp y/y (precautionary saving); heating if down >= 1pp y/y; otherwise steady.
Source: RBA table H2: GGDPICHDISR
80.4 -3.5 over 3m
Down 4.0 pts on the previous month.
Why it matters for Australia: Sentiment below 100 = pessimists outnumber optimists; deep lows often coincide with rate stress.
Rule, caveat & sources caveat
Rule: Heating > 100; cooling < 90; otherwise steady.
Caveat: Latest point is the October 2026 survey (fieldwork 28 Sep-1 Oct, released 7 Oct; straddles the 30 Sep RBA hike). RBA stamps it 31 Oct. Verified against Westpac's release: 80.4, down from 84.4.
Source: RBA table H3: GICWMICS
1808 count/mo 3-mo sum +16% y/y
Up 49.1% on the previous month; highest in the data back to 2021.
Why it matters for Australia: Insolvencies are where high real rates and private-credit refinancing stress become visible.
Rule, caveat & sources caveat
Rule: 3-month sum y/y: stress > +25%; cooling +5% to +25%; otherwise steady.
Caveat: Partial latest month dropped (data to 2026 27 Sep). Aug-2026 construction includes 542 entities of one group (Bathla) entering administration together.
Source: ASIC insolvency statistics Series 1 & 2 (xlsx): Series 1: companies entering external administration
External & commodities
Terms of trade (index)STEADY
94.8 -0.5% over 1y
Down 1.6% on the previous quarter; lowest since Q4 2020.
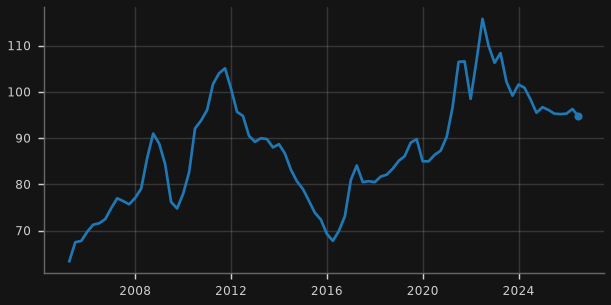
Why it matters for Australia: Export prices vs import prices: the main channel from China's demand to Australian national income and the budget.
Rule & sources
Rule: y/y: heating > +5%; cooling < -5%; otherwise steady.
Source: RBA table H1: GOPITT
Iron ore (US$/t)STEADY
98 US$ -5.4% over 1y
Up 1.5% on the previous month.
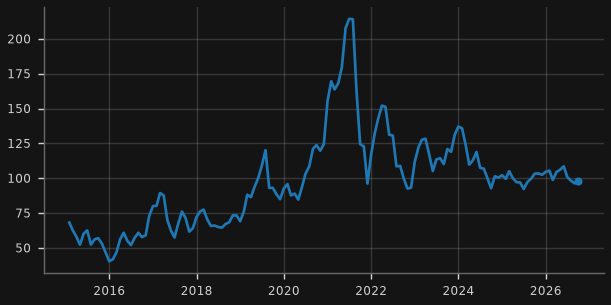
Why it matters for Australia: Australia's largest export; priced off Chinese steel demand.
Rule, caveat & sources caveat
Rule: y/y: heating > +10%; cooling < -10%; otherwise steady.
Caveat: Monthly average prices.
Source: World Bank Pink Sheet (CMO historical monthly): Iron ore, cfr spot
0.7002 US$ +0.3% over 3m
Up 0.5% over the past week.
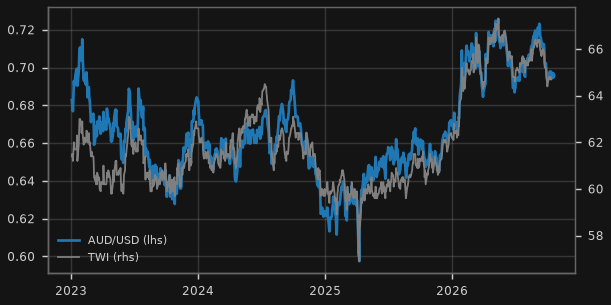
Why it matters for Australia: The AUD is the shock absorber: it falls when China/commodities or global risk appetite weaken.
Rule & sources
Rule: TWI 3-month change: stress if <= -5% (risk-off); heating if >= +5%; otherwise steady.
Source: RBA table F11.1: FXRUSD, FXRTWI
Show 7 more external & commodities chartsHide 7 more external & commodities chartsCurrent account & trade balance (% of GDP) · RBA commodity price index · Thermal coal, Newcastle (US$/t) · LNG, Japan import price (US$/mmbtu) · Gold (US$/oz) · AUD vs CNY and JPY (indexed) · Merchandise export share by destination (12m rolling)
-3.7 % GDP -1.3 over 1y
Down 0.2pt on the previous quarter; lowest since Q2 2016.
Why it matters for Australia: A widening deficit means more reliance on foreign capital (and sensitivity to global funding costs).
106.6 +6.6% over 1y
Up 0.9% on the previous month; highest since Feb 2024.
Why it matters for Australia: Commodity prices in A$ drive mining profits, tax receipts and the AUD.
Rule & sources
Rule: A$ index y/y: heating > +10%; cooling < -10%; otherwise steady.
Source: RBA table I2: GRCPAIAD, GRCPAIUSD
147 US$ +38.4% over 1y
Up 8.8% on the previous month; highest since Sep 2023.
Why it matters for Australia: Coal exports go mostly to Japan, China, Korea, India and Taiwan.
Rule, caveat & sources caveat
Rule: y/y: heating > +10%; cooling < -10%; otherwise steady.
Caveat: Monthly average prices.
Source: World Bank Pink Sheet (CMO historical monthly): Coal, Australian
14.25 US$ +24.2% over 1y
Down 6.7% on the previous month.
Why it matters for Australia: LNG is a top-3 export; Japan/Korea/China are the buyers.
Rule, caveat & sources caveat
Rule: y/y: heating > +10%; cooling < -10%; otherwise steady.
Caveat: Monthly average prices.
Source: World Bank Pink Sheet (CMO historical monthly): Liquefied natural gas, Japan
Gold (US$/oz)HEATING
4,319 US$ +17.7% over 1y
Down 2.1% on the previous month.
Why it matters for Australia: Gold is now a top-3 Australian export and a hedge against real-rate/USD shocks.
Rule, caveat & sources caveat
Rule: y/y: heating > +10%; cooling < -10%; otherwise steady.
Caveat: Monthly average prices.
Source: World Bank Pink Sheet (CMO historical monthly): Gold
AUD/CNY 4.686, AUD/JPY 110.74 -0.9% over 3m
Up 0.2% over the past week.
Why it matters for Australia: AUD/CNY tracks export competitiveness into China; AUD/JPY is the classic carry/risk barometer.
35.2% +1.8pp over 1y
Down 0.2pt on the previous month.
Why it matters for Australia: Concentration risk: roughly a third of goods exports go to one economy.
Rule, caveat & sources caveat
Rule: Context only (no traffic light).
Caveat: Goods only, A$ values; 12-month rolling sums.
Source: ABS Data API (MERCH_EXP): TOT.CHIN+TOT+JAP+RKOR+INIA.TOT.M
Financial stress
MXT 1.670 (2026 15 Oct) -5.6% over 1m
Down 3.7% over the past week.
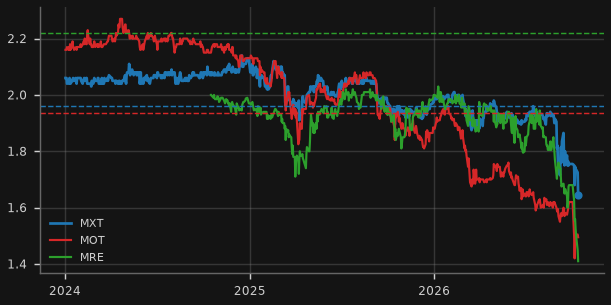
Why it matters for Australia: Discounts to NTA on listed private-credit vehicles are the market's live read on loan-book quality.
Rule, caveat & sources caveat
Rule: Worst discount to latest NTA: stress if > 10%; cooling if 5-10%; otherwise steady.
Caveat: NTAs are MANUAL inputs: audited 30-Jun-2026 values (MXT 1.9617, MOT 1.9346, MRE 2.22) after audit write-downs announced 28 Sep, drawn only from 2026 30 Jun. Units were suspended 28 Sep to 2026 2 Oct (resumed 5 Oct); the price lines break there. Update MANUAL_NTA as monthly NTAs are published. Prices from unofficial Yahoo endpoint.
Source: Yahoo Finance chart endpoint (unofficial): MXT.AX, MOT.AX, MRE.AX; Manual input: audited NTA per unit at 2026 30 Jun (ASX announcements, 2026 28 Sep – 5 Oct): MANUAL_NTA in indicators.py
ASX 200 and financialsSTEADY
8,728 -0.8% over 3m
Unchanged over the past week.
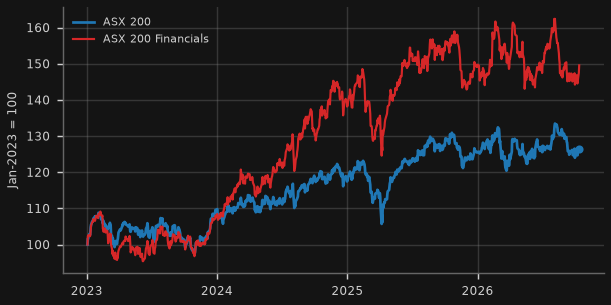
Why it matters for Australia: Bank and broad-equity drawdowns tighten financial conditions and wealth effects.
Rule & sources
Rule: ASX 200: stress if >= 20% below 52-week high; cooling if 10-20% below; heating if within 2% of the 52-week high; otherwise steady.
Source: Yahoo Finance chart endpoint (unofficial): ^AXJO, ^AXFJ
Show 1 more financial stress chartHide 1 more financial stress chartASX 200 A-REITs
ASX 200 A-REITsSTRESS
3,267 -8.8% over 3m
Up 1.2% over the past week.
Why it matters for Australia: Listed property is the most rate-sensitive equity sector and marks commercial property in real time.
Rule & sources
Rule: A-REIT index: stress if >= 20% below 52-week high; cooling if 10-20% below; heating if within 2% of the 52-week high; otherwise steady.
Source: Yahoo Finance chart endpoint (unofficial): ^AXRE
Australia: RBA Chart Pack highlights 9 charts
Selected indicators from the RBA Chart Pack that aren't shown elsewhere on this dashboard, rebuilt from the RBA's public statistical tables (and FRED for US Treasuries). Each card's Takeaway is written from the latest values.
0heating 2steady 2cooling 0stress
Household balance sheet
178.4% +1.5pp over 1y
Up 1.2pt on the previous quarter.
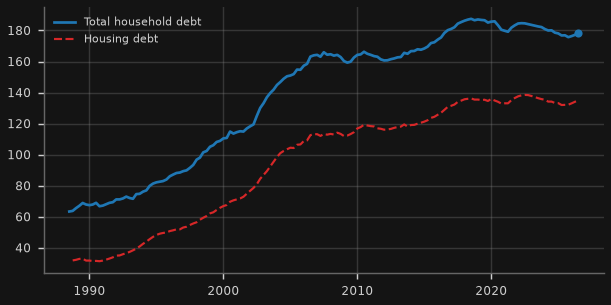
Takeaway: Household debt is 178% of annual disposable income (Q2 2026), housing debt 135%; down 9pp from the post-2015 peak of 188% (Q2 2018).
Why it matters for Australia: Australian households carry some of the highest debt loads in the world; the ratio sets how hard each rate move bites.
Rule, caveat & sources caveat
Rule: Context only.
Caveat: Full E2 history from 1988 (quarterly, annualised income); no splice. Series revised with ABS national accounts benchmarks.
Source: RBA table E2: BHFDDIT, BHFDDIH
9.4% -0.5pp over 1y
Unchanged on the previous quarter.
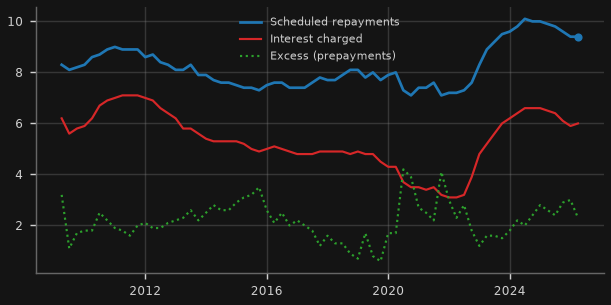
Takeaway: Scheduled mortgage repayments take 9.4% of disposable income (Q1 2026), of which interest 6.0%; borrowers are still paying an extra 2.3% ahead of schedule, and 56% of loans have an offset account.
Why it matters for Australia: The household debt-servicing ratio: the share of income committed to mortgages, the main channel of monetary policy.
Rule, caveat & sources caveat
Rule: Scheduled repayments vs 10-year average: cooling (restrictive) if >= 1pp above; heating if >= 1pp below; otherwise steady.
Caveat: E13 starts Mar 2009 (short by nature: built from post-GFC lender data; no earlier RBA table on this definition). Offset-account share starts Sep 2019.
Source: RBA table E13: LPHTSPRI, LPHTICRI, LPHTEXRI, HSHTOF
Show 1 more household balance sheet chartHide 1 more household balance sheet chartHousehold gearing (debt to assets)
16.1% -0.3pp over 1y
Up 0.1pt on the previous quarter.
Takeaway: Debt is 16.1% of household assets and housing debt 21.9% of housing assets: housing gearing is below its post-2010 average (25.5%).
Why it matters for Australia: Gearing shows how much equity cushion sits under household debt if house prices fall.
Rule, caveat & sources caveat
Rule: Context only.
Caveat: Full E2 history from Sep 1988; dotted line = housing gearing average since 1988.
Source: RBA table E2: BHFDA, BHFHDHA
Lending rates vs the cash rate
7.47% +57bp over 1y
Up 0.01pt on the previous month; highest in the data back to 2019.
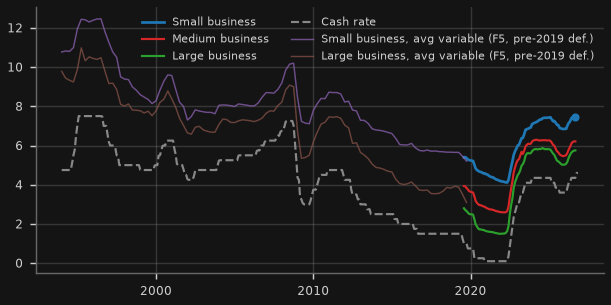
Takeaway: Small businesses pay 7.47% on outstanding loans vs 5.75% for large firms (Aug 2026): a 172bp size premium, with the cash rate at 4.35% that month.
Why it matters for Australia: Small firms pay well above large ones; that premium is how tight policy reaches the SME and non-bank lending market.
Rule, caveat & sources caveat
Rule: Context only.
Caveat: Break: F7 size-based rates (EFS collection) start Jul 2019 and are short by nature; earlier history uses the older F5 weighted-average variable rates (small business from Dec 1993, large from 1978), a different definition, shown as thin lines and not spliced. Cash rate: F1.1 target from Aug 1990, interbank overnight rate before.
Source: RBA table F7: FLRBFOSBT, FLRBFOMBT, FLRBFOLBT; RBA table F5: FILRSBVWA, FILRLBWAV; RBA table F1.1: FIRMMCRT, FIRMMCRI; RBA table F1: FIRMMCRTD
1.85 pp -5bp over 1y
Unchanged on the previous month.
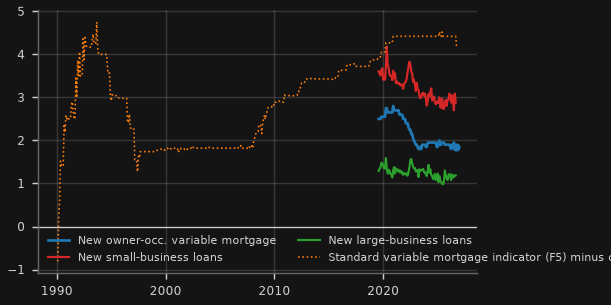
Takeaway: New variable mortgages are priced 1.85pp over the cash rate (Aug 2026), narrower than the 2.53pp pre-COVID average; new small-business loans 2.88pp.
Why it matters for Australia: Spreads over the cash rate show whether banks are passing on policy fully, or competing margins away.
Rule, caveat & sources caveat
Rule: Context only.
Caveat: Break: F6/F7 new-loan rates (EFS) start Jul 2019 (short by nature). Longer context is the F5 banks' standard variable housing indicator rate minus the cash rate (from 1990), a headline rather than actual-paid rate, so not spliced.
Source: RBA table F6: FLRHOFVA; RBA table F5: FILRHLBVS; RBA table F1.1: FIRMMCRT, FIRMMCRI; RBA table F7: FLRBFNSBT, FLRBFNLBT; RBA table F1: FIRMMCRTD
Money & markets
6.9% +0.1pp over 1y
Down 0.8pt on the previous month.
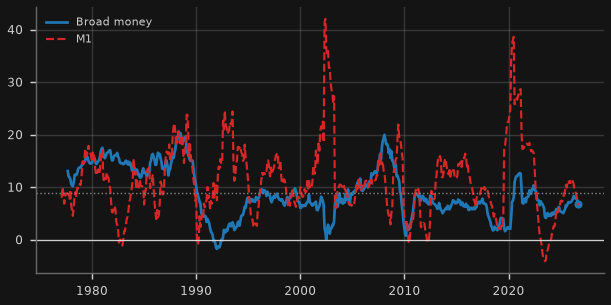
Takeaway: Broad money is growing 6.9% a year and M1 6.5% (Aug 2026).
Why it matters for Australia: Deposits are the other side of bank lending; M1 (transaction balances) swings with rates as savers shift to term deposits.
Rule, caveat & sources caveat
Rule: Broad money y/y: heating > 9%; cooling < 4%; otherwise steady.
Caveat: Full D3 history (broad money from Aug 1976, M1 from 1975). Growth is from levels, not break-adjusted: reclassifications (e.g. 1980s bank/NBFI conversions, 2019 EFS) cause jumps. Dotted line = broad-money average since 1977.
Source: RBA table D3: DMABMS, DMAM1S
0.19 pp +1bp over 1y
Up 0.1pt on the previous month.
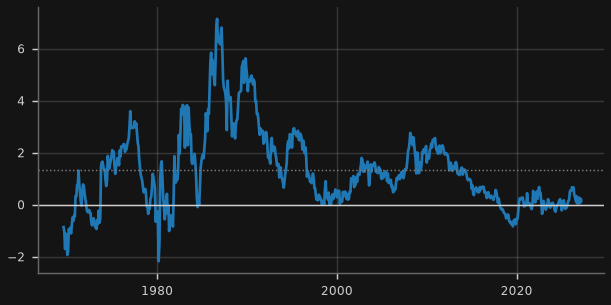
Takeaway: AGS 10y 5.40% vs US 10y 5.28%: Australia yields +12bp over Treasuries (2026 7 Oct), vs a 10-year average of +3bp.
Why it matters for Australia: A positive AU-US spread pulls in foreign capital and supports the AUD; it also tells you whether local long rates are being set offshore.
Rule, caveat & sources caveat
Rule: Context only.
Caveat: Spliced: F2 historical table (f02histhist, month-end, Jul 1969-Apr 2013) + current F2 daily from May 2013 taken at month-end; same 10y benchmark definition. US: FRED DGS10 month-end. Dotted line = average since 1969.
Source: RBA table F2: FCMYGBAG10D; RBA historical table F2 (1969-2013): FCMYGBAG10; FRED (St Louis Fed): DGS10
Inflation & wages
-0.7 pp -2.0pp over 1y
Up 0.2pt on the previous quarter.
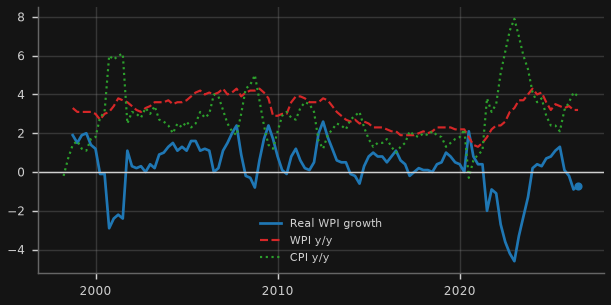
Takeaway: Wages rose 3.2% against 3.9% inflation over the year to Q2 2026: real wages down 0.7%.
Why it matters for Australia: Real wages decide whether households can grow out of their debt; they fell sharply in 2022-23.
Rule, caveat & sources caveat
Rule: Heating > +1.5pp; cooling < 0; otherwise steady.
Caveat: Starts Sep 1998: the ABS Wage Price Index begins in 1997 (first y/y 1998), so this is short by nature; CPI (G1) goes back to 1923.
Source: RBA table H4: GWPIYP; RBA table G1: GCPIAGYP
2.5% -0.1pp over 1y
Down 0.1pt on the previous quarter.
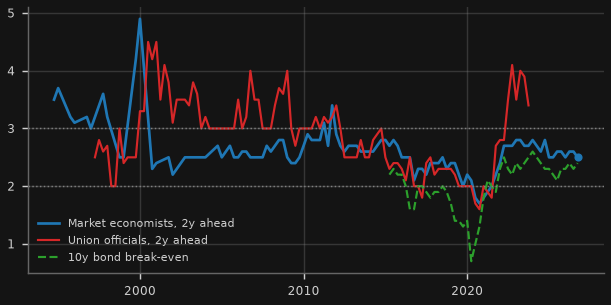
Takeaway: Economists expect 2.5% inflation in two years, unions 3.4%, and bond markets price 2.4% over ten years (Q3 2026): inside the 2-3% target band.
Why it matters for Australia: If 2-year and 10-year expectations stay near 2.5%, the RBA can look through one-off price shocks.
Rule, caveat & sources caveat
Rule: Market economists 2y ahead: heating > 3%; cooling < 2%; otherwise steady.
Caveat: Full G3 history: economists' survey from 1994, union officials from 1997; the 10y break-even series in G3 starts 2015 (short by nature). No splice.
Source: RBA table G3: GMAREXPYY, GUNIEXPYY, GBONYLD
About / sources. A rules-based monitor of the Australian macro and credit cycle from an Asian and US-funding perspective. All data are free public sources: RBA, ABS, BIS, OECD, FRED (St Louis Fed), Federal Reserve Board (H.4.1, GSW yield curve), NY Fed Markets API (reference rates, primary dealer statistics), Japan Ministry of Finance, Cboe index history files, ETF issuer files (State Street, ProShares, Direxion, iShares, Invesco, Roundhill), Fed Financial Accounts (Z.1), Robert Shiller's data, China NBS releases, ASIC, World Bank Pink Sheet, Geopolitical Risk / EPU indices, Yahoo Finance (unofficial chart endpoint). Each card names its series IDs and links to the source; release lags differ by series. Machine-readable latest values: data/latest_summary.csv.
Disclaimer: for information and education only; not financial, investment or tax advice. Data may be revised, delayed or contain errors; check the original source before relying on any figure.