Credit risks: where the spend is going
Last updated: 2026 15 Oct, 09:46 AWST (Perth). Key charts are shown first; tap Show more under a topic for alternative views. All sections & traffic-light overview.
Traffic-light key
HEATING running hot / accelerating / tightening pressure building (e.g. inflation above target, rapid credit growth, rising yields, booming asset prices)
STEADY inside its normal range under the stated rule
COOLING slowing / weakening, or a restrictive setting that is exerting cooling pressure (e.g. high real rates, inverted curve)
STRESS dislocation signal: spreads or insolvencies surging, carry unwind, sharp drawdown, labour-market break (Sahm-style)
INFO context chart only, no traffic-light rule
STEADY inside its normal range under the stated rule
COOLING slowing / weakening, or a restrictive setting that is exerting cooling pressure (e.g. high real rates, inverted curve)
STRESS dislocation signal: spreads or insolvencies surging, carry unwind, sharp drawdown, labour-market break (Sahm-style)
INFO context chart only, no traffic-light rule
Summary from the latest data. Of the 11 rule-based indicators on this page, 7 are running hot, 2 are steady, 1 is cooling and 1 is flashing stress. The stress reading is in the CCC minus BB spread. The hot readings include US data-centre and power construction, US electricity demand, US semiconductor output and 4 others. In the latest data, US nonfinancial corporate debt to GDP is at its lowest since Q4 2016, and hyperscaler capex as a share of operating cash flow is at its highest since the data begin in 2018.
Credit risks: where the spend is going 21 charts
Where US and Australian capex and credit are flowing, and where leverage is building: the data-centre and power build, how the biggest spenders fund it (cash flow vs bonds and leases), credit spreads, bank lending to non-bank lenders, private-credit (BDC) marks, and the Australian side (capex by industry, grid and telecoms construction, business credit by industry). All free public data: BEA, Census, EIA, Fed (H.8, Z.1, G.17, SLOOS), ICE BofA via FRED, SEC EDGAR filings, ABS, RBA. Each card's Takeaway is written from the latest values.
82%Big-5 capex / operating cash flowtrailing 4 qtrs to Q2 2026$85bnUS data-centre constructionSAAR Aug 2026, +73% y/y103bpBBB corporate spread+7bp over 3m316bpHigh-yield spread+47bp over 3m1076bpCCC minus BB spread2026 13 Oct+19% y/yBank loans to non-bank financials$2.08tn, 2026 30 Sep98.9%BDC loans: fair value / costmedian of 5 large BDCs+10.7% y/yAU private capex (real)Q2 2026
7heating 2steady 1cooling 1stress
Where the spend is going (US)
+32.7% +7.6pp over 1y
Down 0.5pt on the previous quarter.
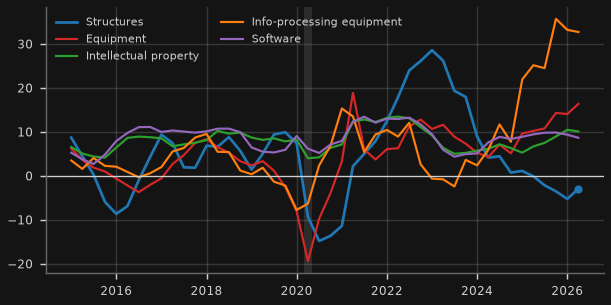
Takeaway: In Q2 2026 info-processing equipment spending was +32.7% y/y and software +8.7%, while structures were -2.9% and equipment overall +16.4%.
Why it matters for Australia: US capex is the demand behind Asian chip and equipment exports and behind the bond issuance that sets global credit spreads; a boom narrowed to one category is more fragile.
Rule, caveat & sources caveat
Rule: Context only.
Caveat: Nominal dollars (BEA current-dollar levels), so price changes are included. Info-processing equipment includes computers, servers and communication gear; software includes own-account software.
Source: FRED (St Louis Fed): B009RC1Q027SBEA, Y033RC1Q027SBEA, Y001RC1Q027SBEA, Y034RC1Q027SBEA, B985RC1Q027SBEA
+0.69 pp GDP 2.2%
Down 0.9pt on the previous quarter.
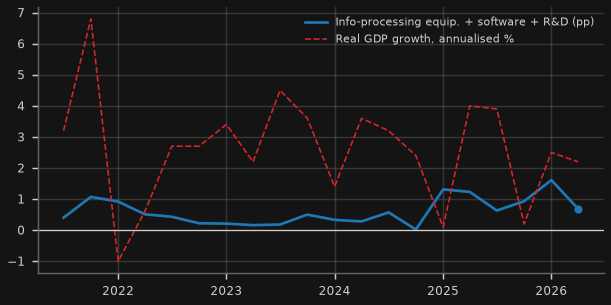
Takeaway: Tech investment added +0.69pp to annualised real GDP growth of 2.2% in Q2 2026 (info-processing equipment +0.19, software +0.33, R&D +0.17).
Why it matters for Australia: When one narrow investment theme supplies a large share of US growth, US (and hence global) growth becomes exposed to that theme's financing and earnings.
Rule, caveat & sources caveat
Rule: Context only.
Caveat: Gross contributions: imported computers and chips are counted here but subtracted elsewhere in GDP (net exports), so the net effect on US output is smaller. Quarterly annualised figures are noisy and revised.
Source: FRED (St Louis Fed): Y034RY2Q224SBEA, B985RY2Q224SBEA, Y006RY2Q224SBEA, A191RL1Q225SBEA
Show 3 more where the spend is going (us) chartsHide 3 more where the spend is going (us) chartsHow fast is US data-centre and power construction growing? ($bn, annual rate) · Is US electricity demand rising with the data-centre build? (12-month sales, % y/y) · Is US chip production keeping up? Semiconductor output (index 2017=100)
85 $bn +73.2% over 1y
Up 7.5% on the previous month; highest in the data back to 2014.
Takeaway: Private data-centre construction ran at $85bn a year in Aug 2026 (+73% y/y), versus $141bn for electric power and $168bn for factories (-20% y/y).
Why it matters for Australia: Data-centre and power-plant building is the physical side of the AI capex boom; it competes for the same electrical equipment, labour and project finance that Australian data-centre and energy projects need.
Rule, caveat & sources caveat
Rule: Data centre construction y/y: heating if > 25%; cooling if < 0%; otherwise steady.
Caveat: Private construction only, current dollars, seasonally adjusted annual rate; excludes the servers and chips inside. Census added the data-centre category in 2014; the latest two months are preliminary and revised.
Source: US Census Bureau, Construction Spending (C30), private SAAR table: privsatime.xlsx: Data center, Electric, Manufacturing, Computer/electronic/electrical
+3.1% all sectors +1.2%
Up 0.09pt on the previous month.
Takeaway: Commercial-sector electricity sales over the 12 months to Jul 2026 were +3.1% y/y and total US sales +1.2%; G.17 power output (12-month average) was +2.3% y/y in Aug 2026.
Why it matters for Australia: Data-centre load shows up first in commercial-sector power sales; faster US power demand supports gas, uranium and grid-equipment prices that matter for Australian exporters and energy costs.
Rule, caveat & sources caveat
Rule: Commercial-sector sales 12-month y/y: heating if > 3%; cooling if < 0%; otherwise steady.
Caveat: EIA monthly sales are preliminary (cutoff sample) for the latest two years and weather-driven; utilities classify data centres as commercial or industrial depending on rate schedule. 12-month sums are used to remove seasonality; the EIA monthly table only carries the last ~2.5 years, so its lines start late 2025 and the longer history is the Fed G.17 electric power output index.
Source: US EIA, Electric Power Monthly Table 5.1: Sales of electricity to ultimate customers by sector; FRED (St Louis Fed): IPG2211S
190.1 +12.4% over 1y
Down 0.1% on the previous month.
Takeaway: US semiconductor output was +12.4% y/y in Aug 2026 (index 190.1).
Why it matters for Australia: US semiconductor output growth is one read on the chip cycle that drives Korean and Taiwanese exports, Asian FX and the regional demand Australia sells into.
Rule, caveat & sources caveat
Rule: y/y: heating if > 10%; cooling if < 0%; otherwise steady.
Caveat: Industrial production of semiconductors and other electronic components (NAICS 3344); a real-output index built partly from price-deflated value, so quality changes matter.
Source: FRED (St Louis Fed): IPG3344S
Who is paying for it: hyperscaler cash flow, debt and credit spreads
82% +21.0pp over 1y
Up 6.5pt on the previous quarter; highest in the data back to 2018.
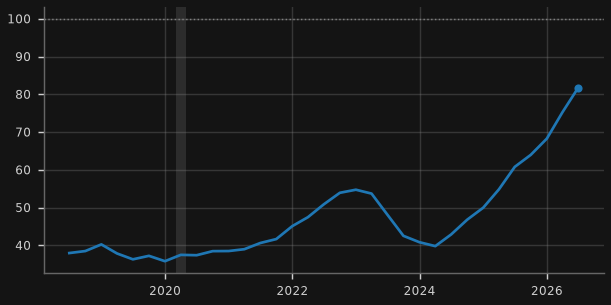
Takeaway: The five largest spenders used 82% of their trailing-year operating cash flow on capex in Q2 2026 (a year earlier 61%), leaving $126bn of combined free cash flow; CoreWeave's capex was 298% of its operating cash flow.
Why it matters for Australia: Above 100% the biggest AI spenders become net borrowers, adding supply to investment-grade bond markets and raising the risk that a capex pull-back hits chip, power and equipment suppliers across Asia.
Rule, caveat & sources caveat
Rule: Combined capex/OCF (Microsoft, Alphabet, Amazon, Meta, Oracle): stress if > 100%; heating if > 75%; otherwise steady.
Caveat: Oracle's fiscal quarters (to Aug, Nov, Feb, May) are aligned to the next calendar quarter end. Capex excludes finance-lease and operating-lease data-centre commitments. CoreWeave (far above 100%) is shown in the per-company panels, not on this line.
Source: SEC EDGAR XBRL companyfacts (10-Q/10-K): PaymentsToAcquirePropertyPlantAndEquipment / PaymentsToAcquireProductiveAssets, NetCashProvidedByUsedInOperatingActivities; MSFT, GOOGL, AMZN, META, ORCL, CRWV
160 $bn Oracle Aug 2026
Up 0.1% on the previous quarter; highest in the data back to 2019.
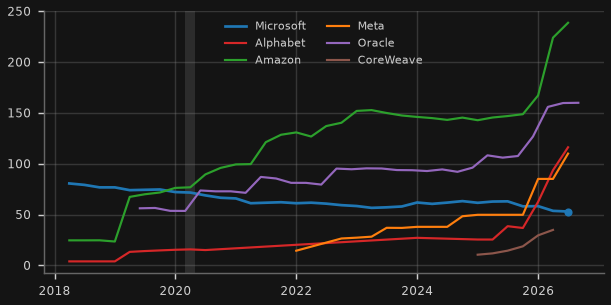
Takeaway: Oracle's debt plus lease liabilities were $160bn at Aug 2026 (vs $108bn a year earlier); CoreWeave's $35bn (Mar 2026).
Why it matters for Australia: Oracle and CoreWeave fund their data-centre build mostly with debt and leases; their bonds, loans and spreads are the early read on whether credit markets will keep financing the AI build.
Rule, caveat & sources caveat
Rule: Context only.
Caveat: Carrying values from balance sheets; lease liabilities are added where tagged (they exclude leases signed but not yet commenced, which for several firms are larger than those on the balance sheet). Commercial paper is excluded. Off-balance-sheet joint ventures (e.g. data-centre SPVs) are not captured.
Source: SEC EDGAR XBRL companyfacts (10-Q/10-K): LongTermDebt (or LongTermDebtNoncurrent + LongTermDebtCurrent; Oracle LongTermNotesAndLoans + NotesPayableCurrent), OperatingLeaseLiability, FinanceLeaseLiability; MSFT, GOOGL, AMZN, META, ORCL, CRWV
103 bp +7bp over 3m
Up 1bp over the past week.
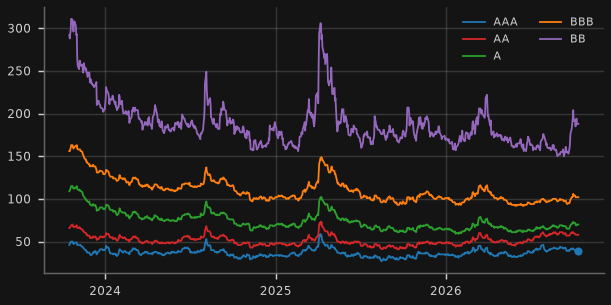
Takeaway: BBB spreads are 103bp (2026 13 Oct), the 43th percentile of the 3 years FRED publishes; AA 59bp, BB 191bp.
Why it matters for Australia: Tight spreads let hyperscalers, Oracle and data-centre developers borrow cheaply; a re-pricing would raise funding costs for every borrower, including Australian banks and corporates that issue offshore.
Rule, caveat & sources caveat
Rule: BBB OAS percentile of the available FRED history: heating (complacent) if <= 15th; stress if >= 85th; otherwise steady.
Caveat: ICE BofA index data on FRED are limited to a rolling ~3-year window by licence, so percentiles are relative to that window only; option-adjusted spreads over Treasuries. Hyperscalers mostly sit in AA/A, Oracle in BBB.
Source: FRED (St Louis Fed): BAMLC0A1CAAA, BAMLC0A2CAA, BAMLC0A3CA, BAMLC0A4CBBB, BAMLH0A1HYBB
Show 4 more who is paying for it: hyperscaler cash flow, debt and credit spreads chartsHide 4 more who is paying for it: hyperscaler cash flow, debt and credit spreads chartsIs each hyperscaler still paying for capex from its own cash? (trailing 4 quarters, $bn) · How big is the contracted cloud backlog that justifies the capex? (remaining performance obligations, $bn) · Is stress building in the weakest borrowers? CCC minus BB spread (bp) · How much debt do US companies carry? Nonfinancial corporate debt (% of GDP)
Big-5 capex $566bn TTM to Q2 2026
Takeaway: Shaded red where trailing-year capex exceeds operating cash flow. Microsoft 63%; Alphabet 71%; Amazon 107%; Meta 69%; Oracle 161%; CoreWeave 298% (capex as % of operating cash flow, latest trailing 4 quarters).
Why it matters for Australia: When capex runs above operating cash flow (red shading) the gap must be funded with bonds, leases or cash reserves; that issuance lands in the same credit markets Australian banks and companies borrow from.
Rule, caveat & sources caveat
Rule: Context only.
Caveat: Capex = cash purchases of property & equipment; it excludes assets acquired under finance leases and data centres taken on operating leases, so true commitments are larger. Fiscal years differ (Microsoft to June, Oracle to May). Quarterly values are derived from year-to-date 10-Q figures.
Source: SEC EDGAR XBRL companyfacts (10-Q/10-K): PaymentsToAcquirePropertyPlantAndEquipment (Amazon: PaymentsToAcquireProductiveAssets), NetCashProvidedByUsedInOperatingActivities; MSFT, GOOGL, AMZN, META, ORCL, CRWV
664 $bn
Up 4.1% on the previous quarter; highest in the data back to 2019.
Takeaway: Latest remaining performance obligations: Microsoft $684bn (Jun 2026); Alphabet $520bn (Jun 2026); Oracle $664bn (Aug 2026); CoreWeave $104bn (Jun 2026).
Why it matters for Australia: Backlog (contracted future revenue) is what lenders lean on when they fund data centres; a backlog concentrated in a few AI-lab customers is a credit risk if those customers cannot pay.
Rule, caveat & sources caveat
Rule: Context only.
Caveat: Amazon does not tag AWS backlog in XBRL after 2020, so it is omitted. RPO counts signed contracts, including multi-year commitments that customers can sometimes reduce; it is not cash.
Source: SEC EDGAR XBRL companyfacts (10-Q/10-K): RevenueRemainingPerformanceObligation; MSFT, GOOGL, ORCL, CRWV
1076 bp +267bp over 3m
Up 47bp over the past week.
Takeaway: CCC bonds yield 1076bp more than BB bonds (2026 13 Oct), against a 3-year median of 717bp (FRED history window).
Why it matters for Australia: The gap between the riskiest (CCC) and safest (BB) junk bonds widens first when defaults are coming, even while headline spreads look calm.
Rule, caveat & sources caveat
Rule: Stress if > 1.5 × its median over the available FRED history (~3 years); heating (complacent) if < 0.75 × median; otherwise steady.
Caveat: FRED carries only ~3 years of ICE BofA history. Index composition shifts as issuers are up- or downgraded; CCC spreads can jump on a few large distressed names.
Source: FRED (St Louis Fed): BAMLH0A3HYC, BAMLH0A1HYBB
48.2% -0.4pp over 1y
Down 0.3pt on the previous quarter; lowest since Q4 2016.
Takeaway: US nonfinancial corporate debt was 48.2% of GDP in Q2 2026 ($15.7tn); a net +0.0% of banks tightened business-lending standards in the Jul 2026 survey.
Why it matters for Australia: High corporate leverage plus tightening bank standards is the classic setup for a US credit downturn, which reaches Australia through funding costs, equity markets and commodity demand.
Rule, caveat & sources caveat
Rule: Context only.
Caveat: Z.1 nonfinancial corporate debt securities and loans (market value basis for securities), divided by nominal GDP (annual rate). SLOOS = net % of banks tightening C&I standards for large and mid-sized firms.
Source: FRED (St Louis Fed): BCNSDODNS, GDP; FRED (St Louis Fed): DRTSCILM
Private credit and non-bank lending
7.2%
Up 0.01pt on the previous quarter.
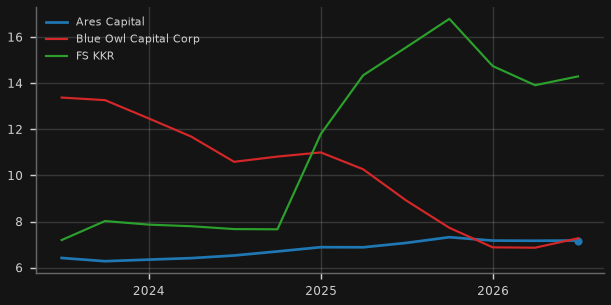
Takeaway: Latest trailing-year PIK share of total investment income: Ares Capital 7.2% (Q2 2026); Blue Owl Capital Corp 7.3% (Q2 2026); FS KKR 14.3% (Q2 2026).
Why it matters for Australia: Payment-in-kind (PIK) interest is added to the loan instead of paid in cash; a rising PIK share means more borrowers cannot service their debt from cash flow.
Rule, caveat & sources caveat
Rule: Context only.
Caveat: Only BDCs that tag PIK interest each quarter are shown (Blackstone Secured Lending stopped tagging it in 2023; Main Street does not tag it). Some PIK is agreed at origination rather than forced by distress.
Source: SEC EDGAR XBRL companyfacts (10-Q/10-K): InterestIncomeOperatingPaidInKind (OBDC: InterestAndDividendIncomeOperatingPaidInKind), GrossInvestmentIncomeOperating; ARCC, OBDC, BXSL, FSK, MAIN
93% -4.2pp over 1y
Up 1.1pt over the past week.

Takeaway: The five BDCs trade at a median 93% of their last reported NAV (2026 14 Oct); Ares Capital 96%, Blue Owl Capital Corp 71%, Blackstone Secured Lending 93%, FS KKR 58%, Main Street 158%. BDC ETF (BIZD) -14% over a year (price only).
Why it matters for Australia: A listed BDC trading well below its reported net asset value signals that the market expects further loan losses than the managers have marked.
Rule, caveat & sources caveat
Rule: Median of the BDCs shown: stress if < 85%; cooling if < 95%; otherwise steady.
Caveat: Daily close divided by the most recent quarter-end NAV per share already filed (NAV is reported with a 4-6 week lag, so recent moves compare against an old NAV). Prices are not total-return adjusted.
Source: Yahoo Finance (unofficial chart endpoint): ARCC, OBDC, BXSL, FSK, MAIN; SEC EDGAR XBRL companyfacts (10-Q/10-K): NetAssetValuePerShare; ARCC, OBDC, BXSL, FSK, MAIN
Show 2 more private credit and non-bank lending chartsHide 2 more private credit and non-bank lending chartsAre banks funding private credit? US bank loans to non-bank financial institutions (% y/y) · Are private-credit loans being marked down? BDC portfolios: fair value as % of cost
+19.5% -35.6pp over 1y
Down 0.7pt over the past week.
Takeaway: Bank loans to non-bank financials were $2.08tn in the week to 2026 30 Sep, +19.5% y/y, versus +5.9% for all bank credit.
Why it matters for Australia: Banks increasingly lend to private-credit funds, BDCs and other non-banks rather than to companies directly; fast growth here is leverage on leverage that can tighten quickly when marks fall.
Rule, caveat & sources caveat
Rule: y/y: heating if > 15%; cooling if < 0%; otherwise steady.
Caveat: H.8 reclassification in early 2025 (banks re-reported loans by borrower type) inflates growth across that period; y/y around 2025 overstates new lending.
Source: FRED (St Louis Fed): LNFACBW027SBOG, TOTBKCR
98.9% latest 10-Q
Down 0.6pt on the previous quarter; lowest since Q1 2023.
Takeaway: Median fair value / cost across five large BDCs is 98.9% (Ares Capital 98.9%, Blue Owl Capital Corp 99.0%, Blackstone Secured Lending 96.4%, FS KKR 90.6%, Main Street 115.5%).
Why it matters for Australia: Business development companies are the listed window into private credit; falling marks relative to cost are the first public sign of losses in loans to mid-sized (often software and services) companies.
Rule, caveat & sources caveat
Rule: Median of the five BDCs: stress if < 95%; cooling if < 98%; otherwise steady.
Caveat: Portfolio-wide marks include equity stakes (large at Main Street, where fair value above cost reflects equity gains). Non-accrual rates are not tagged in XBRL, so they are not shown. Quarterly, 10-Q/10-K.
Source: SEC EDGAR XBRL companyfacts (10-Q/10-K): InvestmentOwnedAtFairValue, InvestmentOwnedAtCost; ARCC, OBDC, BXSL, FSK, MAIN
Australia: capex, data-centre build and credit by industry
51.0 A$bn +10.7% over 1y
Down 3.6% on the previous quarter.
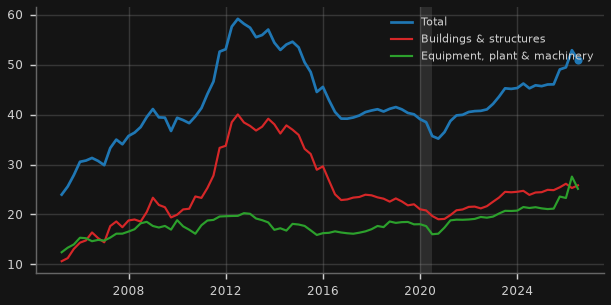
Takeaway: Real private capex was A$51.0bn in Q2 2026 (+10.7% y/y): buildings & structures +3.8%, equipment +18.7%.
Why it matters for Australia: Business investment is where data-centre, energy-transition and mining projects show up in the Australian economy; it also drives demand for business credit.
Rule, caveat & sources caveat
Rule: Total real capex y/y: heating if > 8%; cooling if < 0%; otherwise steady.
Caveat: ABS 5625.0 excludes agriculture, public sector and much of education/health history, and does not capture software or data-centre fit-out separately; seasonally adjusted chain volume measures.
Source: ABS Data API (CAPEX): M1.CVM.1+2+TOT.TOT.20.AUS.Q
+22.6% +6.2pp over 1y
Down 0.5pt on the previous month.
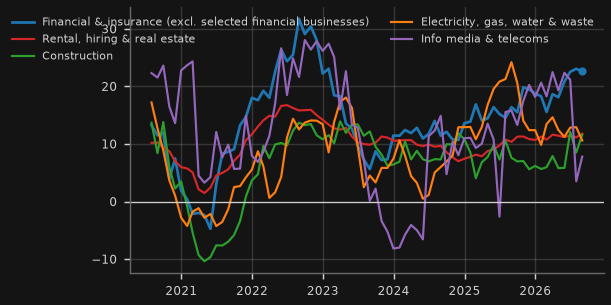
Takeaway: In Aug 2026: Financial & insurance (excl. selected financial businesses) +22.6%; Rental, hiring & real estate +11.8%; Construction +11.6%; Electricity, gas, water & waste +10.6%; Info media & telecoms +7.8% y/y.
Why it matters for Australia: Fast lending growth to property, construction and financial firms is where Australian credit risk tends to build; the RBA and APRA flag both.
Rule, caveat & sources caveat
Rule: Financial & insurance credit y/y: heating if > 15%; cooling if < 0%; otherwise steady.
Caveat: RBA D14.1 starts Jul 2019, is not seasonally adjusted and not break-adjusted (lender reclassifications show as jumps); covers lenders with at least $2bn of business credit.
Source: RBA D14.1 Lending to business by industry (APRA EFS): small+medium+large business finance outstanding by industry
Show 3 more australia: capex, data-centre build and credit by industry chartsHide 3 more australia: capex, data-centre build and credit by industry chartsWhere is Australian capex going? Telecoms/data, energy and property (A$bn, 4-quarter sum) · Is Australia building the grid and networks? Engineering work done (A$bn, 4-quarter sum) · How is the market pricing Australia's listed data-centre builder? NextDC vs ASX 200 (index, Jan 2019 = 100)
24.8 A$bn +90.6% over 1y
Up 13.9% on the previous quarter; highest in the data back to 2005.
Takeaway: Four-quarter capex to Q2 2026: Information media & telecoms A$24.8bn (+91% y/y); Electricity, gas, water & waste A$18.7bn (+10% y/y); Rental, hiring & real estate A$13.2bn (-2% y/y).
Why it matters for Australia: Data-centre builders (AirTrunk, NextDC, CDC) and network owners sit mainly in information media & telecoms and property; energy-transition spend sits in utilities.
Rule, caveat & sources caveat
Rule: Context only.
Caveat: ABS industry of the spending business, not the asset: a data centre owned by a property trust appears under rental, hiring & real estate. Original, current-price data summed over four quarters to remove seasonality.
Source: ABS Data API (CAPEX): M1.CUR.TOT.P08+P03+P10.10.AUS.Q
31.7 A$bn +8.7% over 1y
Up 2.3% on the previous quarter; highest in the data back to 2000.
Takeaway: Electricity engineering work totalled A$31.7bn over the four quarters to Q2 2026 (+9% y/y); telecoms A$7.3bn (-7%).
Why it matters for Australia: Electricity and telecoms engineering work is the Australian version of the US power and data-centre build: it needs project finance, raises import demand and competes for scarce construction labour.
Rule, caveat & sources caveat
Rule: Context only.
Caveat: Engineering construction excludes buildings, so data-centre shells (non-residential building) are not here; current prices, so construction-cost inflation is included.
Source: ABS Data API (EWD): M1.CUR.13.07+10.10.AUS.Q
159 -41% over 1y
Down 6.5% over the past week.
Takeaway: NextDC closed at A$9.57 on 2026 14 Oct, -41% over a year; relative to the ASX 200 it is +1% since Jan 2019.
Why it matters for Australia: NextDC is the only large listed pure-play Australian data-centre developer (AirTrunk is privately owned by Blackstone); its share price is a daily market read on the local AI-infrastructure build and its funding appetite.
Rule, caveat & sources caveat
Rule: Context only.
Caveat: Price indices only (no dividends); NextDC's capacity, contracted MW and debt are in its ASX half-year and annual reports and are not machine-readable here.
Source: Yahoo Finance (unofficial chart endpoint): NXT.AX, ^AXJO
About / sources. A rules-based monitor of the Australian macro and credit cycle from an Asian and US-funding perspective. All data are free public sources: RBA, ABS, BIS, OECD, FRED (St Louis Fed), Federal Reserve Board (H.4.1, GSW yield curve), NY Fed Markets API (reference rates, primary dealer statistics), Japan Ministry of Finance, Cboe index history files, ETF issuer files (State Street, ProShares, Direxion, iShares, Invesco, Roundhill), Fed Financial Accounts (Z.1), Robert Shiller's data, China NBS releases, ASIC, World Bank Pink Sheet, Geopolitical Risk / EPU indices, Yahoo Finance (unofficial chart endpoint). Each card names its series IDs and links to the source; release lags differ by series. Machine-readable latest values: data/latest_summary.csv.
Disclaimer: for information and education only; not financial, investment or tax advice. Data may be revised, delayed or contain errors; check the original source before relying on any figure.