Credit & funding: US dollar and Australian liquidity
Last updated: 2026 15 Oct, 09:46 AWST (Perth). Key charts are shown first; tap Show more under a topic for alternative views. All sections & traffic-light overview.
Traffic-light key
HEATING running hot / accelerating / tightening pressure building (e.g. inflation above target, rapid credit growth, rising yields, booming asset prices)
STEADY inside its normal range under the stated rule
COOLING slowing / weakening, or a restrictive setting that is exerting cooling pressure (e.g. high real rates, inverted curve)
STRESS dislocation signal: spreads or insolvencies surging, carry unwind, sharp drawdown, labour-market break (Sahm-style)
INFO context chart only, no traffic-light rule
STEADY inside its normal range under the stated rule
COOLING slowing / weakening, or a restrictive setting that is exerting cooling pressure (e.g. high real rates, inverted curve)
STRESS dislocation signal: spreads or insolvencies surging, carry unwind, sharp drawdown, labour-market break (Sahm-style)
INFO context chart only, no traffic-light rule
Summary from the latest data. Of the 8 rule-based indicators on this page, 2 are running hot and 6 are steady. No indicator here is at a stress reading. The hot readings include Primary dealer Treasury fails and Discount window: primary & secondary credit. In the latest data, Term Funding Facility outstanding is at its lowest since 2020 10 Jun, and Discount window: primary & secondary credit is at its highest since 2023 26 Apr.
US dollar funding & liquidity 11 charts
2heating 6steady 0cooling 0stress
Live US dollar funding and curve indicators from the NY Fed, Federal Reserve and FRED: repo rates vs interest on reserves, primary-dealer settlement fails, Fed backstop facilities, the near-term forward spread, curve slopes and the copper/gold ratio.
Swap spreads
-36 bp +11bp over 1y
Up 2bp over the past week; highest since 2026 28 Jan.
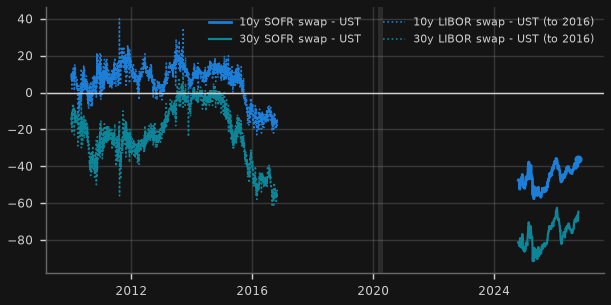
Takeaway: At 2026 14 Oct (5-day medians): 2y -12bp, 5y -26bp, 10y -36bp, 30y -65bp. Long-end spreads remain negative: Treasuries still trade cheap to swaps.
Why it matters for Australia: Swap spreads measure what it costs to hold Treasuries on a dealer balance sheet versus receiving fixed in a swap. Deeply negative 30y spreads mean Treasuries are cheap: heavy supply plus balance-sheet limits (leverage ratio) stop dealers arbitraging them away. A sharp further fall signals Treasury indigestion or funding strain; a rise toward zero signals easier balance-sheet capacity (e.g. SLR relief).
Rule, caveat & sources caveat
Rule: Context only.
Caveat: SOFR swap rates are rebuilt from the DTCC public trade tape (5-day median of daily trimmed medians of spot-starting trades), available from Oct 2024 only. Dotted lines before Oct 2016 are LIBOR-based ICE swap rates, a different benchmark (not spliced). Treasury yields are constant-maturity (bond-equivalent) so spreads are approximate (few bp convention gap).
Source: DTCC public price dissemination (CFTC cumulative rates slice): USD-SOFR fixed-float, spot-start new trades; FRED (St Louis Fed): DGS2, DGS5, DGS10, DGS30; FRED (St Louis Fed): DSWP10, DSWP30 (ICE swap rates, discontinued 2016)
Repo & Fed backstops
-1 bp +2bp over 3m
Down 1bp over the past week.
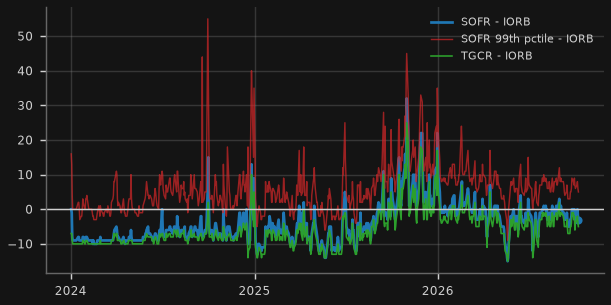
Why it matters for Australia: Repo trading at or above interest on reserves means dealers are balance-sheet constrained and dollar liquidity is getting scarce; the 99th percentile shows the tail of the market paying up first.
Rule, caveat & sources caveat
Rule: 5-day avg SOFR-IORB: stress if > +5bp; heating if > 0bp or SOFR 99th pctile 5-day avg > +10bp; otherwise steady.
Caveat: Month/quarter-end spikes are normal (rule uses 5-day averages). BGCR and TGCR differ by ~0-1bp; TGCR shown. IORB starts Jul-2021.
Source: NY Fed Markets API (SOFR, BGCR, TGCR): rate, 1st/99th percentile, volume; FRED (St Louis Fed): IORB
0.0 US$bn +0.0 over 3m
Down 50.0% over the past week.
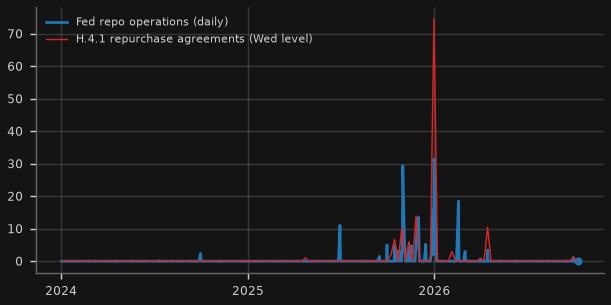
Why it matters for Australia: Use of the Fed's repo backstop shows dealers cannot get private repo at a reasonable price, an early sign of funding strain that spills over to offshore dollar borrowers.
Rule, caveat & sources caveat
Rule: Max over last 20 business days: stress if >= US$50bn; heating if >= US$5bn; otherwise steady.
Caveat: Quarter-end takeup (e.g. 30 Sep) is common and partly window-dressing; the rule looks at the 20-day max, so a quarter-end print alone can trigger 'heating'.
Source: FRED (St Louis Fed): RPONTSYD, WORAL
0.21 US$bn +0.2 over 1y
Unchanged over the past week.
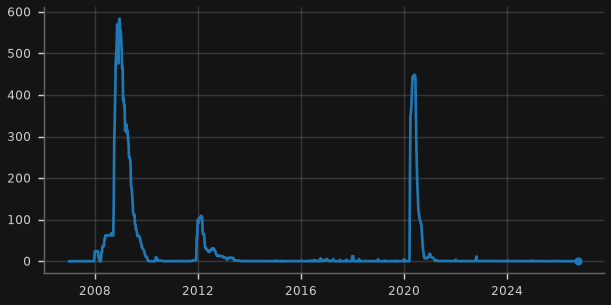
Why it matters for Australia: Swap-line drawings are the clearest sign of an offshore dollar shortage: foreign central banks borrow US dollars from the Fed to lend on to their banks.
Rule & sources
Rule: Latest: stress if >= US$50bn; heating if >= US$5bn; otherwise steady.
Source: FRED (St Louis Fed): SWPT
Show 4 more repo & fed backstops chartsHide 4 more repo & fed backstops chartsSOFR and TGCR volume (US$bn/day) · Primary dealer Treasury fails (deliver + receive, ex-TIPS, US$bn/week) · Discount window: primary & secondary credit (US$bn) · Primary Dealer Credit Facility loans (US$bn, discontinued series)
3,000 US$bn +3.6% over 1y
Up 0.1% over the past week.
Why it matters for Australia: Rising repo volume with flat rates = ample collateral financing; rising rates with flat or falling volume would point to balance-sheet scarcity.
Rule & sources
Rule: Context only (no traffic light).
Source: NY Fed Markets API (SOFR, TGCR): volumeInBillions
260.0 US$bn -18.8% over 1y
Down 33.3% over the past week.
Why it matters for Australia: Settlement fails jump when Treasuries are hard to borrow (collateral scarcity, e.g. Mar-2020); persistent spikes can impair repo intermediation and dollar funding.
Rule, caveat & sources caveat
Rule: 4-week average vs trailing 3-year median: stress if > 2x; heating if > 1.3x; otherwise steady.
Caveat: Weekly cumulative fails reported by primary dealers (Wednesday as-of dates); this API series starts Apr-2013 (older history uses a different series layout).
Source: NY Fed Markets API (Primary dealer statistics): PDFTD-USTET, PDFTR-USTET (US$m, weekly, cumulative for the week)
9.96 US$bn +2.8 over 1y
Up 14.0% over the past week; highest since 2023 26 Apr.
Why it matters for Australia: Banks only borrow at the discount window when market funding fails or stigma is outweighed; spikes mark bank funding stress (2008, 2020, Mar-2023).
Rule, caveat & sources caveat
Rule: Primary credit: stress if >= US$25bn; heating if >= 2x its 3-year median; otherwise steady.
Caveat: Wednesday levels. Seasonal credit (WLCFLSECL) excluded.
Source: FRED (St Louis Fed): WLCFLPCL, WLCFLSCL
0.0 US$bn
Unchanged over the past week.
Why it matters for Australia: The PDCF is the Fed lending directly to securities dealers; it was only used in 2008 and 2020 and is shown for history.
Rule, caveat & sources caveat
Rule: Context only (no traffic light).
Caveat: Spliced from the 2008-era series and the 2020-22 facility series; both discontinued, so this card is history only.
Source: FRED (St Louis Fed): H0RESPPALDDNWW, H41RESPPALDHNWW
Curve & forward signals
+85 bp +50bp over 3m
Down 13bp over the past week.
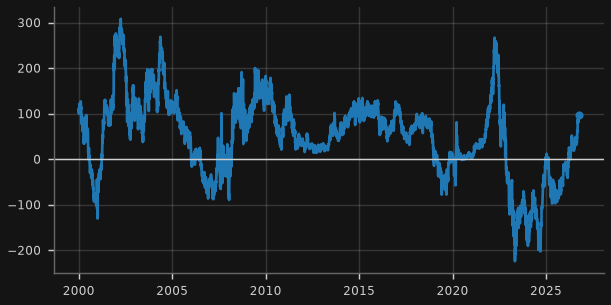
Why it matters for Australia: The Fed's own preferred curve recession signal (Engstrom-Sharpe): a negative spread means markets price rate cuts within 18 months, i.e. expected weakness.
Rule, caveat & sources caveat
Rule: Latest 5-day avg: cooling if < 0bp (cuts priced = recession signal); heating if > +100bp; otherwise steady.
Caveat: Computed here: forward = Svensson zero curve 1.5y-1.75y (converted to quarterly compounding) minus 3m CMT bill (DGS3MO). The Fed's published series uses its own bill-curve fit, so levels differ by a few bp. GSW lags ~1 week.
Source: Federal Reserve GSW zero-coupon curve (feds200628): BETA0-3, TAU1-2 -> Svensson zero yields at 1.5y and 1.75y; FRED (St Louis Fed): DGS3MO
+0.91 pp +21bp over 3m
Down 0.2pt over the past week.
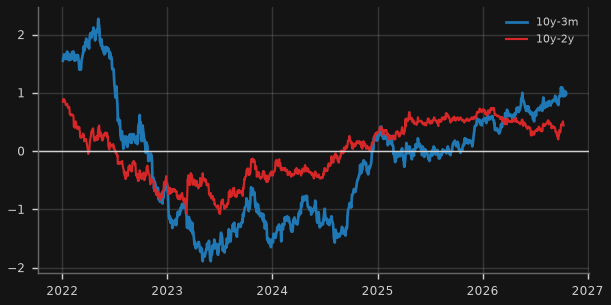
Why it matters for Australia: Curve inversion and the later bull steepening have preceded US recessions; a steep curve with rising long yields can instead reflect term or policy-risk premia.
Rule & sources
Rule: 10y-3m: cooling if < 0 (inverted); otherwise steady.
Source: FRED (St Louis Fed): T10Y3M, T10Y2Y
Show 1 more curve & forward signals chartHide 1 more curve & forward signals chartCopper/gold ratio (x1000) vs US 10y yield
1.60 ratio +34.0% over 1y
Up 0.6% over the past week; highest since 2025 30 Jul.
Why it matters for Australia: Copper (industrial demand) relative to gold (safety, liquidity) tends to track long-term yields; divergence tests whether higher yields reflect growth or other forces.
Rule, caveat & sources caveat
Rule: 3-month change: cooling if <= -10%; heating if >= +10%; otherwise steady.
Caveat: Front-month COMEX futures (US$/lb over US$/oz). Copper was supply-constrained in 2026, which lifts the ratio without implying stronger growth.
Source: Yahoo Finance chart endpoint (unofficial): HG=F; Yahoo Finance chart endpoint (unofficial): GC=F; FRED (St Louis Fed): DGS10
Australia: funding & liquidity 8 charts
How the Australian dollar money market is working: the overnight cash market, the RBA's open market operations, banks' Exchange Settlement (ES) balances, the Term Funding Facility run-off and bank bill funding spreads, rebuilt from the RBA's public statistical tables (F1, A1, A2, A3). Each card's Takeaway is written from the latest values.
0heating 0steady 0cooling 0stress
Overnight cash market
1,245 $m -340.8 over 1y
Down 6.2% over the past week.
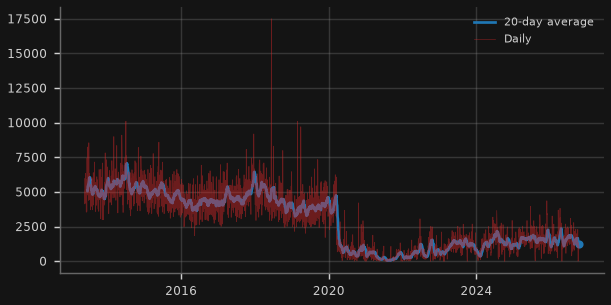
Takeaway: About $1.2b a day now trades in the overnight cash market (2026 14 Oct, 20-day average), well below the 2019 average of $3.9b: banks still hold ample reserves, so few need to borrow overnight.
Why it matters for Australia: When the RBA floods banks with reserves they no longer need to borrow overnight from each other, so the cash market shrinks.
Rule, caveat & sources caveat
Rule: Context only.
Caveat: RBA publishes cash market volumes only from 2013 20 May (F1, short by nature).
Source: RBA F1 Money market (daily): FIRMMCRIV
+0 bp +0bp over 1y
Unchanged over the past week.
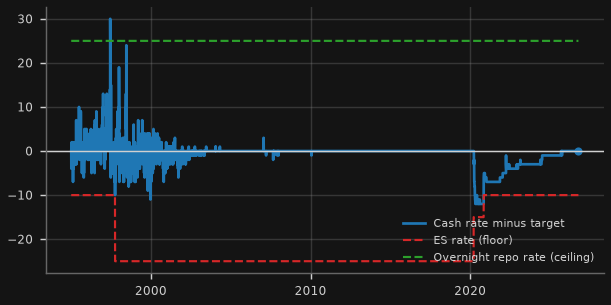
Takeaway: The cash rate is 4.60% vs a 4.60% target (+0bp, 2026 14 Oct), sitting close to the floor (floor -10bp, ceiling +25bp): the hallmark of an ample-reserves system.
Why it matters for Australia: Where the cash rate sits between the ES deposit rate (floor) and the standing-facility repo rate (ceiling) shows whether reserves are scarce or ample.
Rule, caveat & sources caveat
Rule: Context only.
Caveat: Corridor from A2 administered rates (ES rate and standing-facility overnight repo rate) applied as step functions; daily cash rate spliced from the F1 historical xls (to 2010) and current F1 (2011+).
Source: RBA F1 / F1 historical (daily): FIRMMCRID, FIRMMCRTD; RBA A2 Administered rates: ARBAMPNRPESB, ARBAMPNORR
RBA open market operations
46.3 $b +14.7 over 1y
Down 3.3% over the past week.
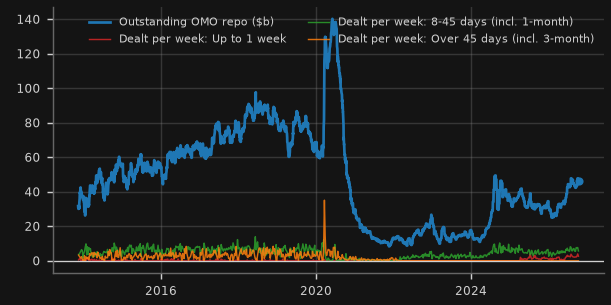
Takeaway: Banks have $46.3b of repo outstanding with the RBA (2026 13 Oct); over the last four weeks $27.3b was dealt at around 1 month and $0.0b at longer terms, vs $11.5b at a week or less.
Why it matters for Australia: Banks now get most of their marginal reserves by borrowing from the RBA at its weekly full-allotment repo operations rather than from each other.
Rule, caveat & sources caveat
Rule: Context only.
Caveat: A3 operations data start Nov 2013. Term buckets are grouped by the term of each transaction; outstanding = OMO reverse repo + triparty reverse repo (outright bond purchases excluded).
Source: RBA A3 ES balances and repo agreements: AORROMO, AORROMOTRI; RBA A3 OMO repo transaction details: AFROMOTD, AFROMOVD
+10 bp (Oct 2026 to date, to 2026 14 Oct) +0bp over 1y
Unchanged on the previous month.
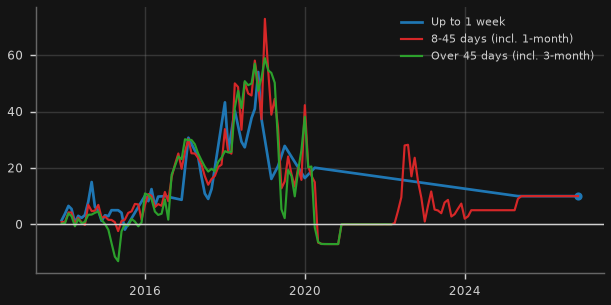
Takeaway: Every RBA OMO repo in Oct 2026 to date, to 2026 14 Oct was priced at +10bp over the cash rate target (7-day +10bp), the full-allotment price the RBA has set since 2025 9 Apr (+5bp from Feb 2024). As the price is administered, the signal is quantity: $46.3b of OMO repo outstanding on 2026 13 Oct, vs $31.6b a year earlier. Before 2024, fixed-rate deals ran from about -13bp to +60bp over the target.
Why it matters for Australia: The RBA prices its weekly full-allotment repo at a fixed spread to the cash rate target, so the amount banks take (repo outstanding, rhs) is the live signal of their reserve demand.
Rule, caveat & sources caveat
Rule: Context only.
Caveat: Value-weighted monthly average of dealt OMO repos (main plus additional rounds); lines break in months with no deals. Pre-2024 deals were fixed-rate (shown as rate minus the target on the deal date, which includes term premium and rate expectations); since Feb 2024 OMO is floating at a published spread: +5bp, then +10bp from 2025 9 Apr. Latest month is partial: Oct 2026 to date, to 2026 14 Oct.
Source: RBA A3 OMO repo transaction details: AFROMOWAR, AFROMOWAS, AFROMOVD, AFROMOTD, AAROMO* (additional rounds); RBA F1 Money market (daily): FIRMMCRTD; RBA A3 ES balances and repo agreements: AORROMO, AORROMOTRI
Reserves, TFF and standing facility
196 $b -7.6 over 1y
Up 3.3% over the past week.
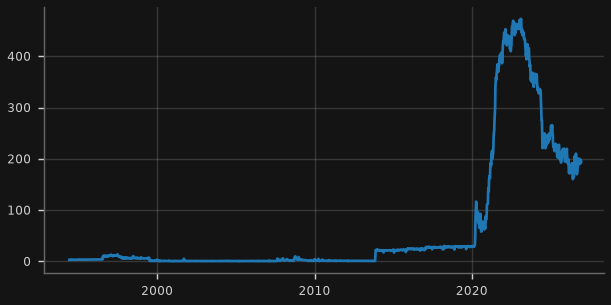
Takeaway: Banks hold $196b in ES balances (2026 7 Oct), down from the $473b peak (Feb 2023) but far above the roughly $29b of 2019.
Why it matters for Australia: ES balances are banks' reserves at the RBA; their surge after 2020 (bond buying and the TFF) is why the cash market went quiet.
Rule, caveat & sources caveat
Rule: Context only.
Caveat: Weekly A1 from Jul 2013, extended back to Jun 1994 with the RBA's historical A1 summary (same series ID).
Source: RBA A1 Balance sheet (weekly): ARBALESBW; RBA A1 historical summary 1994-2023: ARBALESBW
7.7 $b -170.1 over 1y
Down 77.2% over the past week; lowest since 2020 10 Jun.
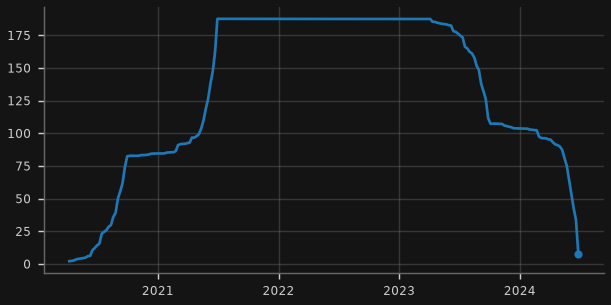
Takeaway: The TFF has fully run off: the last $7.7b was outstanding on 2024 26 Jun, down from a $188b peak (Jun 2021), and the RBA has published no balance since.
Why it matters for Australia: The TFF lent banks about $188b of cheap three-year money in 2020-21; its run-off forced banks to replace it with market funding and RBA repo.
Rule, caveat & sources caveat
Rule: Context only.
Caveat: Facility opened Apr 2020; drawdowns closed Jun 2021 and all funding matured by mid-2024 (short by nature).
Source: RBA A3 Term Funding Facility: ATFFOTD
Show 1 more reserves, tff and standing facility chartHide 1 more reserves, tff and standing facility chartOvernight standing facility repo at the ceiling rate ($m)
0 $m +0.0 over 1y
Unchanged over the past week.
Takeaway: Overnight standing-facility borrowing at the ceiling rate was $0m on 2026 13 Oct and was used on 12 of the last 250 business days, averaging $175m (max $525m) when used: no sign of system-wide stress. Separately, $4.2b of open (intraday-liquidity) repo sits at the ES rate.
Why it matters for Australia: Banks borrowing overnight from the RBA at the penalty (ceiling) rate signals an individual bank could not find cash in the market.
Rule, caveat & sources caveat
Rule: Context only.
Caveat: 'SF repos at margin' = standing-facility repos at the cash rate target plus margin; open repos at the ES rate (for RITS intraday liquidity) are reported separately and noted in the takeaway.
Source: RBA A3 ES balances and repo agreements: AORRLFPR, AORRLFCRT
Bank bill funding spreads
+17 bp +19bp over 1y
Up 1bp over the past week.
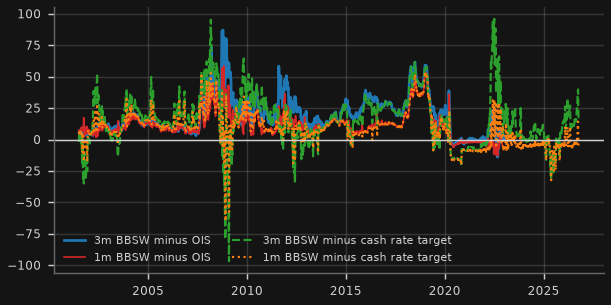
Takeaway: 3m BBSW is +17bp over the cash rate target and 1m -3bp (2026 14 Oct); the last published 3m BBSW-OIS spread was +2bp (Dec 2022) vs a GFC peak of +87bp.
Why it matters for Australia: BBSW over OIS strips out rate expectations to show pure bank credit and liquidity stress (GFC, 2020); after OIS data ends the gap to the cash rate target also reflects expected rate moves.
Rule, caveat & sources caveat
Rule: Context only.
Caveat: 5-day averages. RBA OIS (F1) runs Jul 2001 to 2022 1 Dec only; after that only the BBSW minus cash rate target proxy is available (it embeds expected cash-rate changes). Bank bill rates spliced from F1 historical xls.
Source: RBA F1 / F1 historical (daily): FIRMMBAB30D, FIRMMBAB90D, FIRMMOIS1D, FIRMMOIS3D, FIRMMCRTD
About / sources. A rules-based monitor of the Australian macro and credit cycle from an Asian and US-funding perspective. All data are free public sources: RBA, ABS, BIS, OECD, FRED (St Louis Fed), Federal Reserve Board (H.4.1, GSW yield curve), NY Fed Markets API (reference rates, primary dealer statistics), Japan Ministry of Finance, Cboe index history files, ETF issuer files (State Street, ProShares, Direxion, iShares, Invesco, Roundhill), Fed Financial Accounts (Z.1), Robert Shiller's data, China NBS releases, ASIC, World Bank Pink Sheet, Geopolitical Risk / EPU indices, Yahoo Finance (unofficial chart endpoint). Each card names its series IDs and links to the source; release lags differ by series. Machine-readable latest values: data/latest_summary.csv.
Disclaimer: for information and education only; not financial, investment or tax advice. Data may be revised, delayed or contain errors; check the original source before relying on any figure.