Passive flows & market structure
Last updated: 2026 15 Oct, 09:46 AWST (Perth). Key charts are shown first; tap Show more under a topic for alternative views. All sections & traffic-light overview.
Traffic-light key
HEATING running hot / accelerating / tightening pressure building (e.g. inflation above target, rapid credit growth, rising yields, booming asset prices)
STEADY inside its normal range under the stated rule
COOLING slowing / weakening, or a restrictive setting that is exerting cooling pressure (e.g. high real rates, inverted curve)
STRESS dislocation signal: spreads or insolvencies surging, carry unwind, sharp drawdown, labour-market break (Sahm-style)
INFO context chart only, no traffic-light rule
STEADY inside its normal range under the stated rule
COOLING slowing / weakening, or a restrictive setting that is exerting cooling pressure (e.g. high real rates, inverted curve)
STRESS dislocation signal: spreads or insolvencies surging, carry unwind, sharp drawdown, labour-market break (Sahm-style)
INFO context chart only, no traffic-light rule
Summary from the latest data. The 18 charts on this page give context and carry no traffic-light rules. In the latest data, US nonfinancial corporate equity market value to GDP is at its highest since the data begin in 1949.
Passive flows & market structure 18 charts
How the growth of index funds and ETFs shows up in US market plumbing: money created into the big S&P 500 and Nasdaq-100 ETFs, leveraged and single-stock ETF assets, the gap between cap-weighted and equal-weighted indices, when returns are earned (overnight vs during the session), options-implied correlation and dispersion, corporate net equity issuance and valuation context. Passive-flow / market-structure indicators, context only (no traffic lights). Each card's Takeaway is written from the latest values.
Money into index ETFs
-0.1 $b
Down +0.3 $b over the past week.
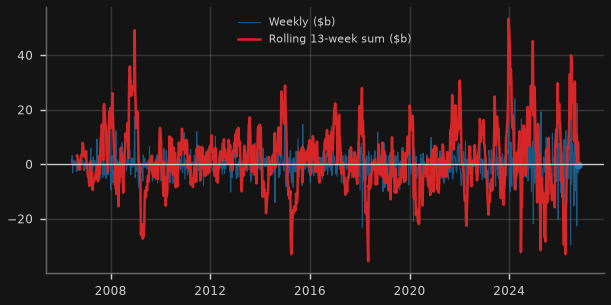
Takeaway: SPY saw -0.1b in the week to 2026 12 Oct and +0.2b over 13 weeks; +9b year to date (2026 12 Oct latest file). Shares outstanding: 1.06b.
Why it matters for Australia: Each new SPY share is created when an authorised participant hands the trust a basket of S&P 500 stocks, so the change in shares outstanding times NAV is the money that came in (or left) through the fund.
Rule, caveat & sources caveat
Rule: Context only.
Caveat: Implied flow = daily change in shares outstanding × prior-day NAV (State Street file; shares outstanding start 2006 31 May). SPY is heavily used by traders, so weekly swings are large and partly reverse.
Source: State Street SPY NAV history (shares outstanding, NAV): SPY navhist
101.6
Down 0.1% over the past week.
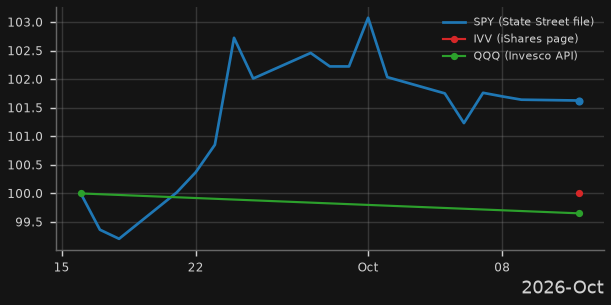
Takeaway: Latest issuer shares outstanding: IVV 1.147b (2026 12 Oct); QQQ 0.672b (2026 12 Oct); SPY 1.055b (2026 12 Oct). Too few points yet for a trend.
Why it matters for Australia: IVV, VOO and QQQ issuers publish only today's shares outstanding, so the dashboard stores each week's value; comparing their growth with SPY separates long-horizon holders (cheaper IVV/VOO) from trading vehicles (SPY).
Rule, caveat & sources caveat
Rule: Context only.
Caveat: History starts 2026 16 Sep (first stored snapshot) and grows one point per refresh. VOO shares outstanding are not published in a fetchable form (Vanguard), so VOO vs SPY cannot be shown yet.
Source: iShares IVV product page; Invesco QQQ fund details; State Street SPY NAV history: shares outstanding
Leveraged, inverse and single-stock ETFs
38.6 $b
Down 3.7% over the past week.
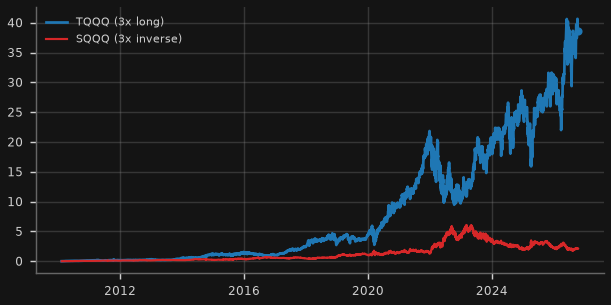
Takeaway: TQQQ holds $38.6b and SQQQ $2.1b (2026 12 Oct): long-leveraged money is 18x the inverse side.
Why it matters for Australia: Leveraged ETFs must buy after up days and sell after down days to reset their exposure, so their size shows how much mechanical, momentum-style trading sits on top of the index.
Rule, caveat & sources caveat
Rule: Context only.
Caveat: Assets under management from ProShares' daily file (from Feb 2010). Daily rebalancing flows depend on the day's index move, not shown here.
Source: ProShares historical NAV files (TQQQ, SQQQ): AUM, shares outstanding
-0.7 $b
Down +0.5 $b over the past week.
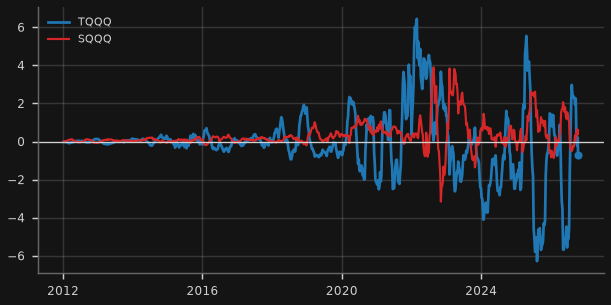
Takeaway: Over the 13 weeks to 2026 12 Oct, TQQQ took -0.7b and SQQQ +0.6b.
Why it matters for Australia: Money tends to flow into the leveraged long fund after falls (buy the dip) and into the inverse fund after rallies, so the two often move against each other.
Rule, caveat & sources caveat
Rule: Context only.
Caveat: Implied flow = change in shares outstanding × prior NAV, summed weekly then over 13 weeks.
Source: ProShares historical NAV files: Shares outstanding × NAV
Show 1 more leveraged, inverse and single-stock etfs chartHide 1 more leveraged, inverse and single-stock etfs chartLeveraged and thematic ETF assets, latest ($b)
90.6 $b
Takeaway: Largest: TQQQ (12 Oct) 38.6b, DRAM (30 Sep) 25.9b, SOXL (12 Oct) 20.1b, TSLL (13 Oct) 3.8b, SQQQ (12 Oct) 2.1b.
Why it matters for Australia: A snapshot of the biggest leveraged and concentrated ETFs; issuers other than ProShares publish only today's shares outstanding, so history accumulates week by week in the dashboard's snapshot file.
Rule, caveat & sources caveat
Rule: Context only.
Caveat: Assets = shares outstanding × latest close where the issuer does not publish assets. Single-stock funds (NVDL, MSTU and others) are covered in full in the single-stock cards below. DRAM (Roundhill Memory ETF) is actively managed and unleveraged; shown as the memory-chip theme fund.
Source: Direxion daily holdings files (SOXL, TSLL); Roundhill DRAM fact sheet; ProShares NAV files; Yahoo Finance closes: shares outstanding × price
Single-stock leveraged and inverse ETFs
26.1 $b as of 2026 13 Oct
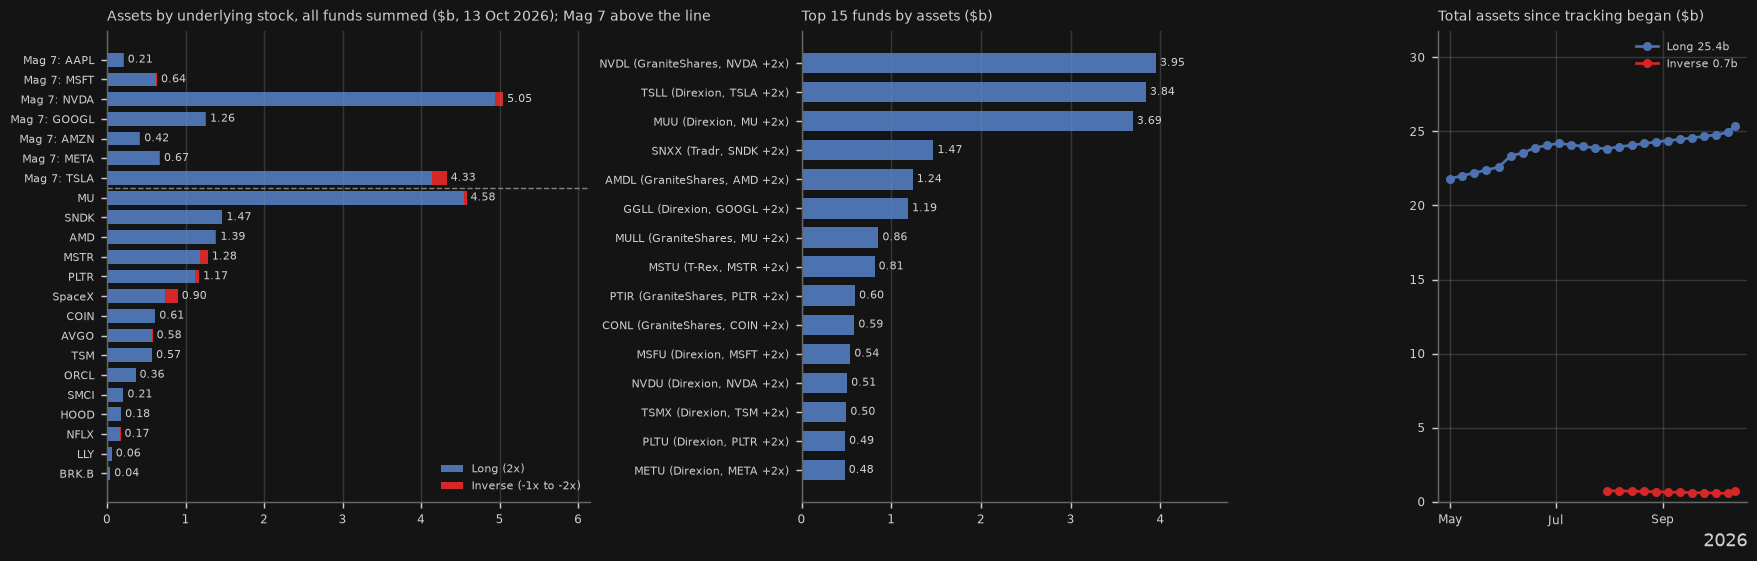
Takeaway: 91 funds hold $26.2b ($25.4b long, $0.7b inverse, 34x more long); the Mag 7 account for $12.6b (48%). Largest by stock: NVDA $5.0b, MU $4.6b, TSLA $4.3b; largest fund NVDL $4.0b.
Why it matters for Australia: Single-stock leveraged ETFs give 2x (or -1x/-2x) a company's daily move and must trade the stock (via swaps) every day to stay at that multiple; their size shows how much mechanical buying and selling sits on top of a few popular stocks.
Rule, caveat & sources caveat
Rule: Context only.
Caveat: 91 US-listed funds on 22 stocks (universe checked 2026 13 Oct; funds under about $5m and other stocks omitted). Assets as published by each issuer (GraniteShares shows assets rounded to 3 significant figures; Direxion assets derived from holdings weights). Stale: TSMG (24 Aug) (issuer file not updated). Only ProShares publishes daily history; other issuers' history before 2026 12–13 Oct is month-end SEC N-PORT-P net assets (quarter-end months only, interpolated between points), and snapshots are stored each weekly refresh. Time line starts 2026 30 Apr.
2.65 $b rebalancing on a ±5% day, Mag 7 + 10 largest others summed (2026 13 Oct)
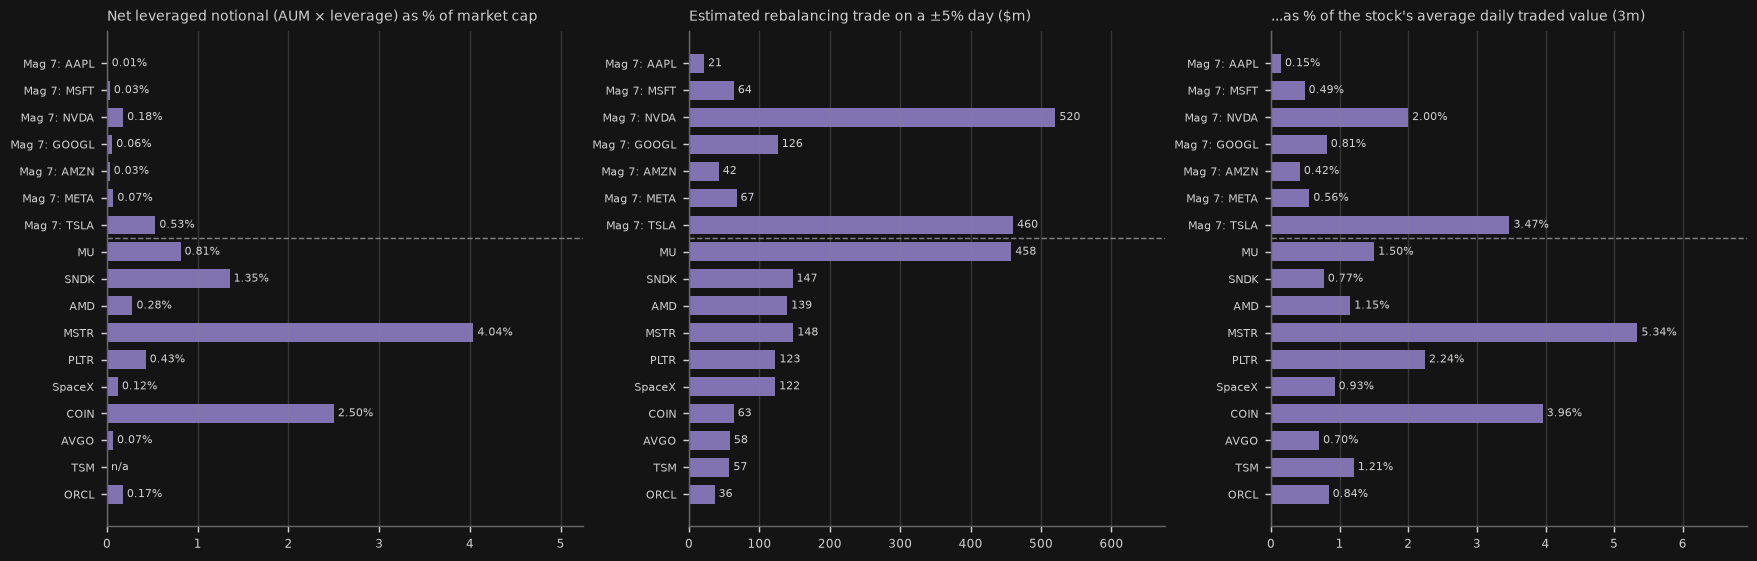
Takeaway: On a ±5% day, rebalancing would be largest relative to trading in MSTR (148m = 5.27% of ADV), COIN (63m = 3.97% of ADV), TSLA (460m = 3.50% of ADV); net notional is biggest vs market cap in MSTR 4.30%, COIN 2.61%, SNDK 1.43%. For the Mag 7 combined: 1,302m on a 5% move.
Why it matters for Australia: A 2x fund must buy more of the stock after it rises and sell after it falls (an inverse fund too: it buys back its short after a rise). The size of that same-direction trade, relative to how much of the stock normally trades, shows how much leveraged ETFs can amplify a big move into the close.
Rule, caveat & sources caveat
Rule: Context only.
Caveat: Rebalance need for one fund ≈ AUM × L × (L−1) × the day's return (2x long: 2 × AUM × r; −2x: 6 × AUM × r; −1x: 2 × AUM × r), always in the direction of the move; funds' rebalancing is summed per stock. Real trades are smaller where funds use swaps hedged by dealers who net exposures, and can be spread over the day. Market cap = latest SEC-reported shares (cover page count, else balance sheet or weighted-average count) × latest close; SpaceX uses Q2 2026 weighted-average shares (IPO 12 Jun), so its market cap is understated and % figures overstated. BRK.B and TSM market cap n/a (share classes / ADR ratio). GOOGL traded value includes GOOG. Leveraged ETFs outside the US (e.g. Europe, Korea, Hong Kong) are not included.
Source: Fund assets as in the card above; Yahoo Finance daily close and volume (unofficial chart endpoint); SEC XBRL company facts (shares outstanding): AUM × L; AUM × L(L−1) × 5%; 63-day average close × volume
Show 2 more single-stock leveraged and inverse etfs chartsHide 2 more single-stock leveraged and inverse etfs chartsSingle-stock leveraged ETFs: implied flows by underlying (13 weeks) · SpaceX (SPCX) leveraged and inverse ETFs: assets by fund ($m)
-2,907 $m (97% of AUM covered) net implied flow, last 13 weeks to 2026 13 Oct
Takeaway: 97% of sslev AUM has history covering the 13-week window. Net implied flow -2,907m; biggest: NVDA -947m, MSFT -600m, MU -568m. 13-week aggregate -2.94b. Inaccurate (hatched, needs more history): SpaceX 19%.
Why it matters for Australia: Creations and redemptions show whether traders are adding or pulling leveraged bets on each stock: inflows after a stock falls are dip-buying; outflows after a rally are profit-taking.
Rule, caveat & sources caveat
Rule: Context only.
Caveat: Implied flow = change in shares outstanding × prior NAV (same calculation as the SPY/TQQQ cards), summed per stock from funds whose history covers the full 13-week window. Bars are always drawn; where those funds are <80% of that stock's single-stock leveraged ETF AUM the bar is hatched/faded and the panel carries an 'INACCURATE — NEEDS MORE HISTORY' watermark. ProShares (NVDB, TSLI, SPCF) has daily history. 79 other funds are backfilled with month-end net assets from SEC N-PORT-P filings (only each fiscal quarter's final month is public, ~60-day lag; mostly 31 Mar/30 Apr and 30 Jun/2026 31 Jul), shares = net assets ÷ the fund's own split-adjusted close; between those points and the issuer snapshots (from 2026 12–13 Oct) shares are interpolated linearly, so weekly timing inside the window is approximate and only the 13-week total is meaningful. Funds launched after the last public N-PORT (mostly SpaceX funds) have no history yet. Headline and the flow-pause single-stock condition use the same ≥80% AUM-coverage rule (today 97%). Flow-pause stays n/a below the threshold because a partial sum would show a flow sign driven by which funds happen to have history.
Source: Issuer data: Direxion holdings files; GraniteShares, REX (T-Rex), Defiance, Tradr, Leverage Shares fund pages; ProShares NAV files; SEC N-PORT-P month-end net assets (history before Oct 2026): change in shares outstanding × prior NAV
900 $m as of 2026 13 Oct
Takeaway: 12 SpaceX funds hold $0.9b ($0.7b long, $0.2b inverse); largest SPCH 368m. SPCF (ProShares) has seen +114m of implied flow since launch. A ±5% SPCX day implies about 122m of rebalancing (0.92% of ADV).
Why it matters for Australia: SpaceX listed on Nasdaq (ticker SPCX) on 2026 12 Jun; a dozen 2x long, 2x inverse and 1x inverse funds launched within days, the fastest build-out of leveraged products on a new listing so far.
Rule, caveat & sources caveat
Rule: Context only.
Caveat: Funds launched 2026 12–15 Jun (DSPC 27 Aug). SPCF (ProShares) has daily history since launch; others are weekly snapshots from 2026 30 Apr. Leverage on a new, volatile listing can be limited by swap availability, position limits and float (see issuer risk notes).
Concentration
120.9
Down 1.7% over the past week.
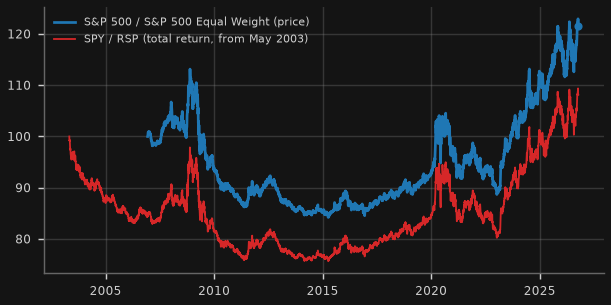
Takeaway: Cap-weight has beaten equal-weight by 3.3% over the past year (2026 14 Oct); the ratio is 121 vs 100 in Dec 2006, at its high.
Why it matters for Australia: Index funds buy in proportion to market value, so new money goes mostly to the largest stocks; a rising line means the biggest companies are outrunning the average stock.
Rule, caveat & sources caveat
Rule: Context only.
Caveat: Price indices from Dec 2006 (Yahoo's ^SPXEW history); SPY/RSP uses dividend-adjusted ETF prices from May 2003. Equal weight rebalances quarterly.
Source: Yahoo Finance (unofficial chart endpoint): ^GSPC, ^SPXEW; SPY, RSP adjusted close
39.0%
Up 2.6pt since Q2 2026 (no data for Q3 2026).
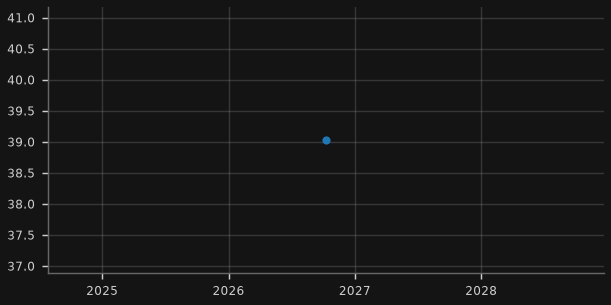
Takeaway: The ten largest holdings are 39.0% of SPY (2026 9 Oct).
Why it matters for Australia: The share of the S&P 500 held in its ten largest companies is the plainest measure of concentration.
Rule, caveat & sources caveat
Rule: Context only.
Caveat: Quarter-end points from SPY's public SEC N-PORT-P filings (sum of the ten largest holding lines, from Sep 2019; ~60-day filing lag), then the SSGA daily holdings file for recent snapshots (one point per refresh). Same definition in both: ten largest lines, GOOGL and GOOG counted separately.
Source: State Street SPY daily holdings file (latest): Weight; SEC EDGAR: SPDR S&P 500 ETF Trust N-PORT-P (quarterly history): Holding pctVal
When returns are earned
1,384
Down 0.5% over the past week.
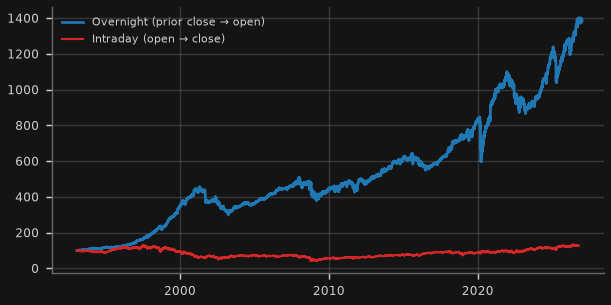
Takeaway: Since 1993, $100 held only overnight grew to $1,384 vs $126 held only during the session; past 12 months: overnight +15.0%, intraday +1.1% (2026 14 Oct).
Why it matters for Australia: Index-fund and ETF buying is concentrated around the open and close; a large overnight share of returns is one sign that flows rather than daytime price discovery are driving prices.
Rule, caveat & sources caveat
Rule: Context only.
Caveat: Price only (dividends excluded, which go ex overnight). Early SPY opens on Yahoo may be stale. Both start at 100 in Jan 1993.
Source: Yahoo Finance (unofficial chart endpoint): SPY daily open, close
Correlation and dispersion
11.7 -4.3 over 1y
Up 0.2 pts over the past week.
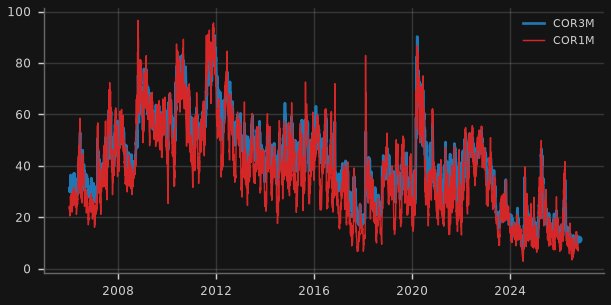
Takeaway: 3-month implied correlation is 11.7 (2026 13 Oct), higher than 2% of days since 2006; 1-month 7.6.
Why it matters for Australia: Implied correlation measures how much options traders expect S&P 500 stocks to move together; low readings mean index moves are driven by a few large names diverging from the rest.
Rule, caveat & sources caveat
Rule: Context only.
Caveat: Cboe history from Jan 2006 (back-calculated before the 2023 relaunch of the methodology).
Source: Cboe index historical data: COR1M, COR3M
36.8 -2.0 over 1y
Up 1.7 pts over the past week.
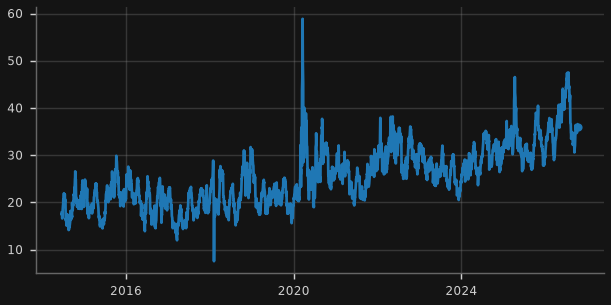
Takeaway: DSPX is 36.8 (2026 13 Oct), higher than 96% of days since 2014.
Why it matters for Australia: DSPX is the options market's expected spread of individual stock returns around the index over 30 days; high dispersion with low correlation is typical of a concentrated, flow-driven market.
Rule, caveat & sources caveat
Rule: Context only.
Caveat: History from Jun 2014.
Source: Cboe index historical data: DSPX
Supply of shares and valuation
262% +44.0pp over 1y
Up 37.5pt on the previous quarter; highest in the data back to 1949.
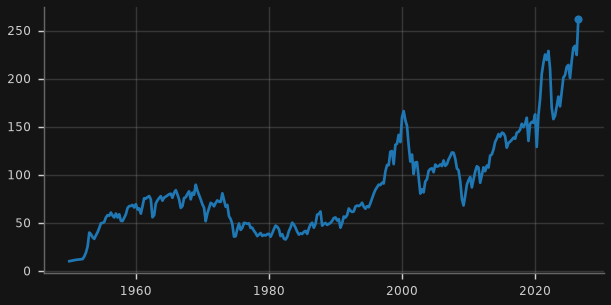
Takeaway: Equity value is 262% of GDP at 2026Q2, the highest since 1946 (long-run median 74%).
Why it matters for Australia: Equity market value relative to the size of the economy is a broad valuation gauge (a cousin of the 'Buffett indicator').
Rule, caveat & sources caveat
Rule: Context only.
Caveat: Market value of nonfinancial corporate equities (excludes financial firms) over the trailing four-quarter sum of nominal GDP from the same release. Quarterly; about 10 weeks lag.
Source: Federal Reserve Financial Accounts (Z.1), S.11.1 and S.1.1: LM103164105.Q / 4Q sum FU086902005.Q
40.7 x +1.5 over 1y
Up 0.3% on the previous month.
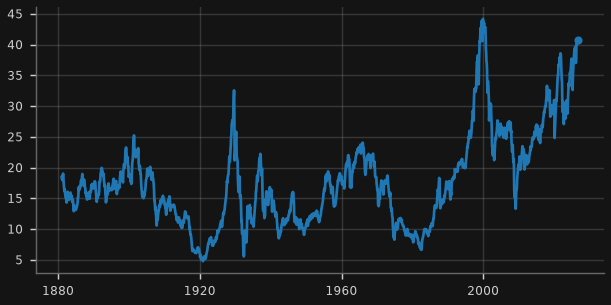
Takeaway: CAPE is 40.7 (Oct 2026) vs a long-run median of 16.6; near the Dec-1999 peak of 44.2.
Why it matters for Australia: The cyclically adjusted P/E compares prices with a decade of inflation-adjusted earnings; high readings have historically gone with low 10-year returns.
Rule, caveat & sources caveat
Rule: Context only.
Caveat: Latest month uses Shiller's estimated earnings and CPI; monthly averages of daily prices.
Source: Robert Shiller, ie_data.xls (shillerdata.com): CAPE
Show 1 more supply of shares and valuation chartHide 1 more supply of shares and valuation chartUS nonfinancial corporate net equity issuance ($tn, annual rate)
+0.61 $tn
Up 198.8% on the previous quarter; highest in the data back to 1946.
Takeaway: Net issuance was +0.61tn a year in 2026Q2 (+1.9% of GDP); the 4-quarter average is +0.03tn.
Why it matters for Australia: Buybacks and cash takeovers retire more shares than companies issue, so the supply of stock shrinks while passive savings keep buying it.
Rule, caveat & sources caveat
Rule: Context only.
Caveat: Seasonally adjusted annual rate, net of buybacks and M&A retirements. Read from the Fed's Z.1 CSV package because FRED was unreachable during the build (same series as FRED NCBCEBQ027S/BOGZ1FA103164105Q).
Source: Federal Reserve Financial Accounts (Z.1), table S.11.1 (CSV files): FA103164105.Q
Flow-pause warning (early-warning heuristic)
3 of 6 on: AMBER as of 2026 15 Oct
Unchanged over the past week.
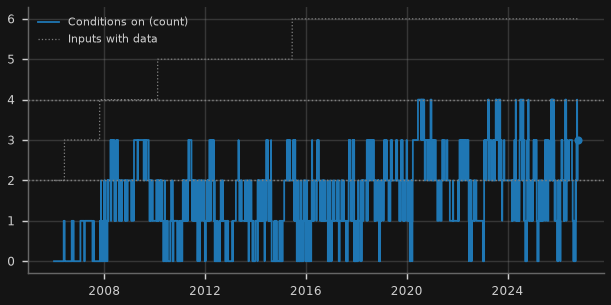
Takeaway: 3 of 6 conditions are on (AMBER). Initial claims 4-wk avg > 15% above 12-month low: off [0.0% above low (03 Oct)]; Withheld tax receipts (20-day y/y) > 3pp below 1-yr avg, or below CPI: off [+6.3% y/y vs 1y avg +4.0%, CPI 3.7% (13 Oct)]; SPY 13-week creations negative: off [+0.15b (12 Oct)]; TQQQ 13-week flows negative: ON [-0.70b (12 Oct)]; Single-stock leveraged ETFs: aggregate 13-week flows negative: n/a [excluded until weekly snapshots build up (history is interpolated quarterly SEC data); provisional 13-week -2.94b]; COR3M below 10th percentile AND DSPX above 90th: ON [COR3M 11.7 = 4th pct, DSPX 36.8 = 96th pct (13 Oct)]; Net equity issuance (4q avg) above long-run average: ON [4q avg +0.03tn vs long-run avg -0.11tn (2026Q2)].
Why it matters for Australia: Passive inflows depend on pay cheques flowing into retirement and brokerage accounts and on leveraged/ETF buyers staying in. This card counts seven simple conditions that would each suggest those flows are slowing (weaker jobs and wages, ETF redemptions, fragile market structure, more share supply). It is an early-warning checklist, not a timing signal: conditions can stay on for months without a sell-off, and sell-offs can start with few of them on.
Rule, caveat & sources caveat
Rule: Traffic light on the count: GREEN 0-1, AMBER 2-3, RED 4+ (of the conditions with data). Context heuristic only; not part of the section's scored indicators.
Caveat: Thresholds are judgement calls set once, up front. Percentiles and averages use only data available at each date (expanding windows), but inputs start at different times (SPY creations 2006, withheld taxes 2006, TQQQ 2010, Cboe correlation/dispersion history from its start), so the count's history is not like-for-like. Leveraged-buyer input: TQQQ is kept because it is the one leveraged fund with 16 years of daily history (so it can be backtested), and it is still the largest leveraged ETF; aggregate single-stock leveraged flows were added alongside it because by 2026 single-stock funds hold a comparable pool of the most speculative, retail-driven money concentrated in a few stocks, and their redemptions are a more direct read on that money stepping back. It is currently excluded (n/a, not in the denominator) until weekly snapshots build up, because its history is interpolated quarterly SEC data; it has no backtest. Light backtest: 2007-09 GFC (S&P 500 peak 2007 9 Oct): inputs available: 3/7; count in 12m before peak: max 1, avg 0.5, at peak 0 (prior 4 years avg 0.5); share of days each was on: claims 0%, spy 49%, iss 0% | 2020 Covid crash (peak 2020 19 Feb): inputs available: 6/7; count in 12m before peak: max 3, avg 1.7, at peak 0 (prior 4 years avg 1.4); share of days each was on: claims 8%, withheld 7%, spy 58%, tqqq 98%, corr 0%, iss 0% | 2022 bear market (peak 2022 3 Jan): inputs available: 6/7; count in 12m before peak: max 3, avg 1.8, at peak 1 (prior 4 years avg 1.9); share of days each was on: claims 19%, withheld 2%, spy 33%, tqqq 46%, corr 0%, iss 80% | Base rate since all/most inputs exist: since Feb 2010 the count was >= 3 on 18% of days and >= 4 on 3% of days
Coverage
The main sources of mechanical, price-insensitive buying and selling in US equities, and where this dashboard tracks each one. 'Gap' means no free, timely public series was found.
| Flow source | Dashboard chart(s) | Coverage |
|---|---|---|
| ETF / fund flows | SPY creations, 3x Nasdaq-100 flows, ETF shares outstanding index | covered |
| Retirement-plan default contributions | gap: no free timely series (401(k)/target-date flows are only in annual or lagged ICI/Fed data) | |
| Benchmark / index changes | Top-10 weight in SPY, Cap- vs equal-weight | partial: concentration only, no rebalance or add/delete calendar |
| Model portfolios | gap | |
| CTAs (trend followers) | gap: no free positioning estimate (CFTC COT could be a proxy) | |
| Vol-control funds | VIX | partial: volatility level only, no exposure estimate |
| Risk parity | Implied correlation | partial: correlation context only |
| Leveraged-ETF resets / rebalancing | Single-stock leveraged ETF rebalancing vs volume, Single-stock leveraged ETF flows, 3x Nasdaq-100 assets, Leveraged ETF snapshot | covered |
| Dealer hedging (options gamma) | Dispersion index | gap for gamma itself (no free dealer-positioning data); dispersion as context |
About / sources. A rules-based monitor of the Australian macro and credit cycle from an Asian and US-funding perspective. All data are free public sources: RBA, ABS, BIS, OECD, FRED (St Louis Fed), Federal Reserve Board (H.4.1, GSW yield curve), NY Fed Markets API (reference rates, primary dealer statistics), Japan Ministry of Finance, Cboe index history files, ETF issuer files (State Street, ProShares, Direxion, iShares, Invesco, Roundhill), Fed Financial Accounts (Z.1), Robert Shiller's data, China NBS releases, ASIC, World Bank Pink Sheet, Geopolitical Risk / EPU indices, Yahoo Finance (unofficial chart endpoint). Each card names its series IDs and links to the source; release lags differ by series. Machine-readable latest values: data/latest_summary.csv.
Disclaimer: for information and education only; not financial, investment or tax advice. Data may be revised, delayed or contain errors; check the original source before relying on any figure.