US economy, rates & global credit
Last updated: 2026 15 Oct, 09:46 AWST (Perth). Key charts are shown first; tap Show more under a topic for alternative views. All sections & traffic-light overview.
Traffic-light key
HEATING running hot / accelerating / tightening pressure building (e.g. inflation above target, rapid credit growth, rising yields, booming asset prices)
STEADY inside its normal range under the stated rule
COOLING slowing / weakening, or a restrictive setting that is exerting cooling pressure (e.g. high real rates, inverted curve)
STRESS dislocation signal: spreads or insolvencies surging, carry unwind, sharp drawdown, labour-market break (Sahm-style)
INFO context chart only, no traffic-light rule
STEADY inside its normal range under the stated rule
COOLING slowing / weakening, or a restrictive setting that is exerting cooling pressure (e.g. high real rates, inverted curve)
STRESS dislocation signal: spreads or insolvencies surging, carry unwind, sharp drawdown, labour-market break (Sahm-style)
INFO context chart only, no traffic-light rule
Summary from the latest data. Of the 32 rule-based indicators on this page, 8 are running hot, 18 are steady, 3 are cooling and 3 are flashing stress. The stress readings are in BDC index ETF (BIZD): listed US private-credit proxy, US high-yield OAS vs CCC-and-below OAS and US leveraged-loan ETF prices: FLBL and BKLN. The hot readings include US Treasury 2y & 10y, US high-yield & IG corporate spreads, Chicago Fed NFCI & St Louis stress index and 5 others. In the latest data, Credit-to-GDP gaps are at their highest since Q3 2020, and US core PCE vs Dallas Fed trimmed-mean PCE inflation is at its lowest since Jul 2021.
US economy, rates & global credit 38 charts
8heating 18steady 3cooling 3stress
US rates, dollar & funding
FF 3.88%, real +0.62pp -0.9pp over 1y
Down 0.02pt on the previous month.
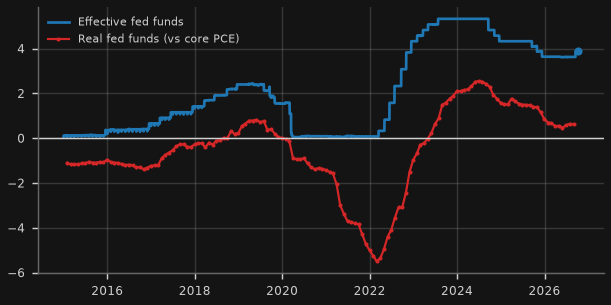
Why it matters for Australia: The Fed sets the global price of money; a high real Fed funds rate is the anchor for real rates everywhere, including Australia.
Rule, caveat & sources caveat
Rule: Real fed funds (monthly avg effective rate minus core PCE y/y): cooling (restrictive) if > 1.5pp; heating (stimulatory) if < 0; otherwise steady.
Caveat: Real rate observed only in months where core PCE is published (no interpolation).
Source: FRED (St Louis Fed): DFF; FRED (St Louis Fed): PCEPILFE
US Treasury 2y & 10yHEATING
5.21% +64bp over 3m
Down 0.06pt over the past week.
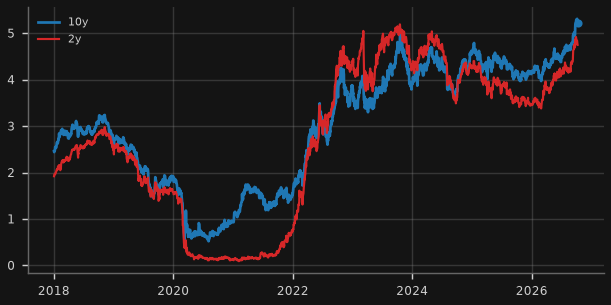
Why it matters for Australia: The 10y Treasury anchors global mortgage and corporate funding costs, including Australia's 10y.
Rule & sources
Rule: 10y, 3-month change: heating (tightening) if >= +40bp; cooling if <= -40bp; otherwise steady.
Source: FRED (St Louis Fed): DGS10, DGS2
+0.37 pp +0bp over 3m
Down 0.1pt over the past week.
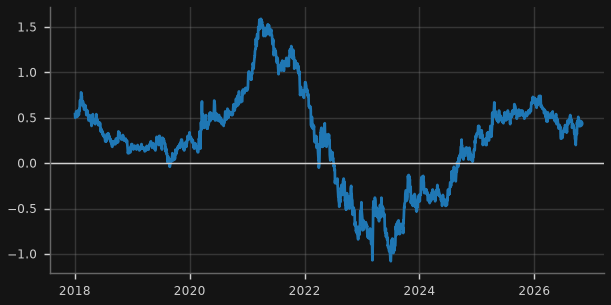
Why it matters for Australia: Curve shape signals whether markets see the Fed as too tight (inverted) or expect growth/inflation and term premium (steep).
Rule & sources
Rule: Cooling if inverted (< 0); heating if > 1.25pp (steep); otherwise steady.
Source: FRED (St Louis Fed): T10Y2Y
121.6 +0.9% over 3m
Up 0.2% over the past week.
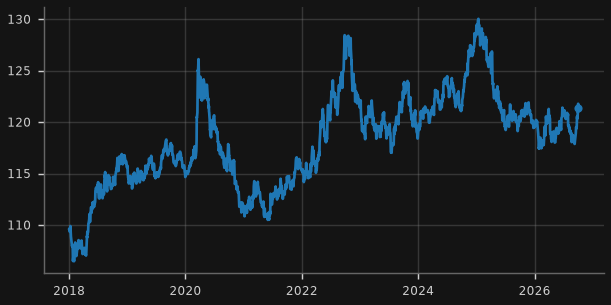
Why it matters for Australia: A rising dollar tightens financial conditions for Asian USD borrowers and pressures the AUD.
Rule & sources
Rule: 3-month change: stress if >= +3% (dollar squeeze); heating (easy) if <= -3%; otherwise steady.
Source: FRED (St Louis Fed): DTWEXBGS
Show 3 more us rates, dollar & funding chartsHide 3 more us rates, dollar & funding chartsUS 20-year Treasury yield and the 6% level · US 10y real yield (TIPS) & breakeven · SOFR minus IORB (repo funding pressure, bp)
5.60% +51bp over 3m
Down 0.08pt over the past week.
Why it matters for Australia: Long-bond yields set the cost of long-term funding; around 6% is a level where hedging pressure in long-bond futures is thought to intensify, which can make moves faster.
Rule, caveat & sources caveat
Rule: Context only: distance of the 20y yield from the 6% reference line.
Caveat: FRED DGS20 daily from 1962; no 20-year series was published from Jan 1987 to Sep 1993 (gap). Dotted line = 6% reference level, not a forecast. Full history in the interactive view.
Source: FRED (St Louis Fed): DGS20
2.88% +53bp over 3m
Down 0.03pt over the past week.
Why it matters for Australia: The global real rate: the hurdle every leveraged asset must clear, from US private credit to Australian property.
Rule & sources
Rule: Cooling (restrictive) if > 2%; heating if < 1%; otherwise steady.
Source: FRED (St Louis Fed): DFII10, T10YIE
-1 bp +2bp over 3m
Down 1bp over the past week.
Why it matters for Australia: Repo stress (SOFR above interest on reserves) means dollar liquidity is getting scarce, which hits offshore USD borrowers and carry trades first.
Rule, caveat & sources caveat
Rule: 5-day average: stress if > +5bp (repo trading above IORB = reserve scarcity); cooling if > 0bp; otherwise steady.
Caveat: Month/quarter-end spikes are normal; rule uses a 5-day average.
Source: FRED (St Louis Fed): SOFR, IORB, RRPONTSYD
US & global credit conditions
3.16% +45bp over 3m
Up 0.1pt over the past week.
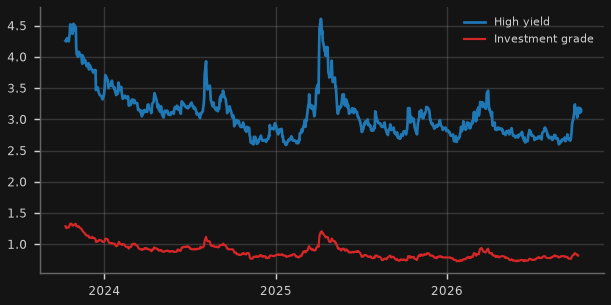
Why it matters for Australia: The bellwether of the global credit cycle; private credit marks lag but follow it.
Rule, caveat & sources caveat
Rule: HY OAS: stress > 6%; cooling 4.5-6%; heating < 3.5% (very easy credit); otherwise steady.
Caveat: ICE BofA indices via FRED (FRED serves a rolling window of history only).
Source: FRED (St Louis Fed): BAMLH0A0HYM2, BAMLC0A0CM
-0.49 +0.0 over 3m
Unchanged over the past week.
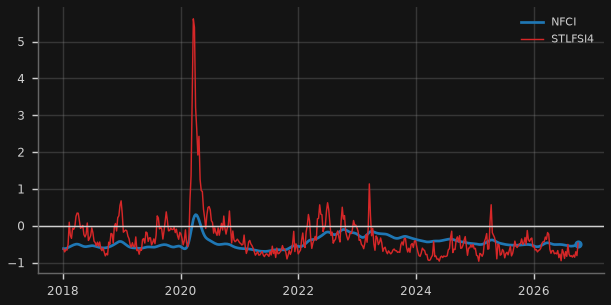
Why it matters for Australia: Broad US financial conditions; tightening here tends to transmit to Asian funding markets.
Rule & sources
Rule: NFCI: stress > 0 (tighter than average); heating < -0.3 (loose); otherwise steady.
Source: FRED (St Louis Fed): NFCI, STLFSI4
VIXSTEADY
15.3 -2.4 over 1m
Up 0.3 pts over the past week.
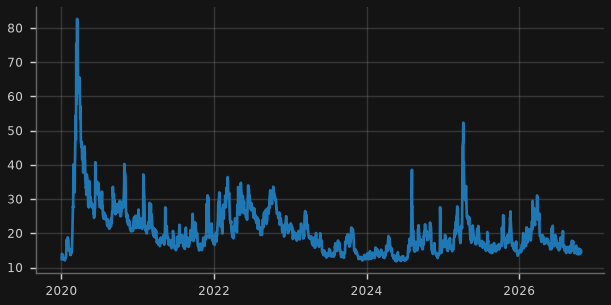
Why it matters for Australia: Volatility shocks force deleveraging across carry trades and risk assets, including the AUD.
Rule & sources
Rule: Stress > 30; cooling 20-30; heating < 13; otherwise steady.
Source: FRED (St Louis Fed): VIXCLS
Show 4 more us & global credit conditions chartsHide 4 more us & global credit conditions chartsAsia USD corporate & EM high-yield spreads · BDC index ETF (BIZD): listed US private-credit proxy · US banks tightening C&I lending standards (net %) · US bank C&I loans (y/y)
0.91% +8bp over 3m
Up 0.01pt over the past week.
Why it matters for Australia: What Asian borrowers pay for dollar credit; widening hits Chinese developers and regional banks first.
Rule & sources
Rule: Percentile of trailing 10 years: stress >= 90th; cooling 70-90th (credit tightening); heating <= 20th (very tight spreads = easy credit); otherwise steady. Applied to Asia corporate OAS.
Source: FRED (St Louis Fed): BAMLEMRACRPIASIAOAS, BAMLEMHBHYCRPIOAS
12.02 US$ -5.5% over 3m
Down 0.1% over the past week.
Why it matters for Australia: Listed BDCs are the daily-priced window into US direct lending; sell-offs here have led stress in Australian private-credit trusts.
Rule, caveat & sources caveat
Rule: BIZD price: stress if >= 20% below 52-week high; cooling if 10-20% below; heating if within 2% of the 52-week high; otherwise steady.
Caveat: Price only (excludes ~10%+ distribution yield); VanEck BDC Income ETF tracks MarketVector US Business Development Companies index.
Source: Yahoo Finance chart endpoint (unofficial): BIZD
+0.0 net % -9.5 over 1y
Down 8.1pt on the previous quarter; lowest since Q4 2024.
Why it matters for Australia: Bank credit supply leads defaults by ~a year; tightening pushes borrowers to private credit.
Rule & sources
Rule: Stress > 20; cooling 0-20; heating < -10; otherwise steady.
Source: FRED (St Louis Fed): DRTSCILM
US bank C&I loans (y/y)COOLING
10.0% +13.1pp over 1y
Up 0.4pt on the previous month; highest since Mar 2023.
Why it matters for Australia: Bank business lending vs private credit: which channel is funding US corporates.
Rule & sources
Rule: Heating if y/y > 10% or 3-mo annualised growth exceeds y/y by > 1pp (accelerating); cooling if 3-mo annualised is > 1pp below y/y (decelerating); otherwise steady.
Source: FRED (St Louis Fed): BUSLOANS
US economy
3.0% -0.2pp over 3m
Up 0.02pt on the previous month.
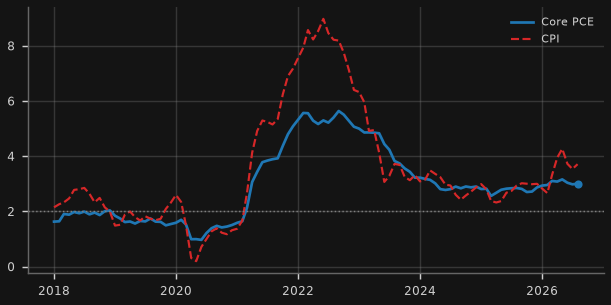
Why it matters for Australia: US inflation decides how far the Fed can cut (or must hike), and so the global floor under real rates.
Rule & sources
Rule: Core PCE: heating > 3%; cooling < 2%; otherwise steady.
Source: FRED (St Louis Fed): PCEPILFE, CPIAUCSL
4.2% -0.2pp over 1y
Up 0.1pt on the previous month.
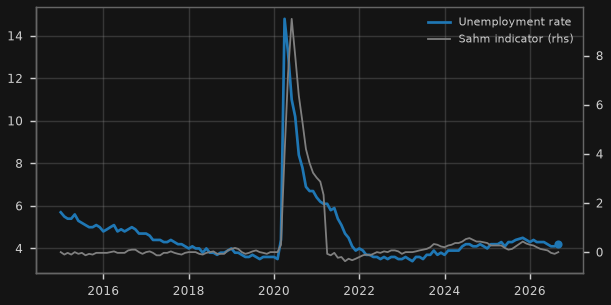
Why it matters for Australia: A rising US jobless rate is the classic trigger for a global easing cycle and risk-off.
Rule & sources
Rule: Stress if 3-mo avg >= 0.5pp above its low of the prior 12 months (Sahm-style); else cooling if 3-mo avg up >= 0.2pp y/y; heating if down >= 0.2pp y/y; otherwise steady. The Fed's official real-time Sahm indicator (SAHMREALTIME, recession signal >= 0.50) is shown for reference.
Source: FRED (St Louis Fed): UNRATE, SAHMREALTIME
198 '000 -15.4% over 1y
Down 1.2% over the past week; lowest since 2022 1 Oct.
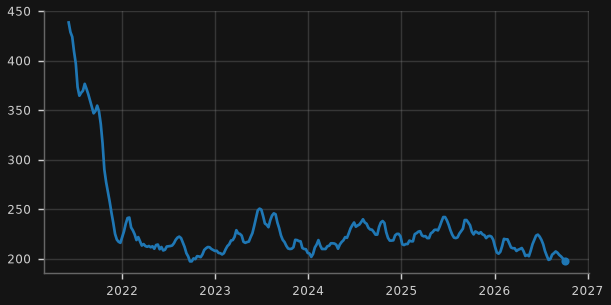
Why it matters for Australia: Weekly, real-time read on US layoffs.
Rule & sources
Rule: 4-wk average y/y: stress >= +20%; cooling >= +10%; heating <= -10%; otherwise steady.
Source: FRED (St Louis Fed): ICSA
Show 2 more us economy chartsHide 2 more us economy chartsFed balance sheet (US$tn) · Brent crude (US$/bbl)
6.75 US$tn +2.4% over 1y
Up 0.1% over the past week.
Why it matters for Australia: QT drains dollar liquidity that ultimately funds global carry and credit.
Rule & sources
Rule: y/y: cooling (QT) if < -5%; heating (QE) if > +5%; otherwise steady.
Source: FRED (St Louis Fed): WALCL
Brent crude (US$/bbl)HEATING
125.4 US$ +87.0% over 1y
Up 10.1% over the past week.
Why it matters for Australia: Oil drives Australian fuel inflation and Asia's import bill (most of Asia is a net oil importer); LNG contracts are oil-linked.
Rule, caveat & sources caveat
Rule: y/y: heating > +20%; cooling < -20%; otherwise steady.
Caveat: EIA Brent spot (physical, dated) via FRED, lags a few days. In Oct-2026 physical Dated Brent (~US$129 on 7 Oct) traded ~US$28 above ICE front-month futures (~US$100) because of Hormuz disruption, so headline futures quotes look much lower.
Source: FRED (St Louis Fed): DCOILBRENTEU
US labour market (early signals)
34.4 hrs +0.2 over 1y
Unchanged on the previous month.
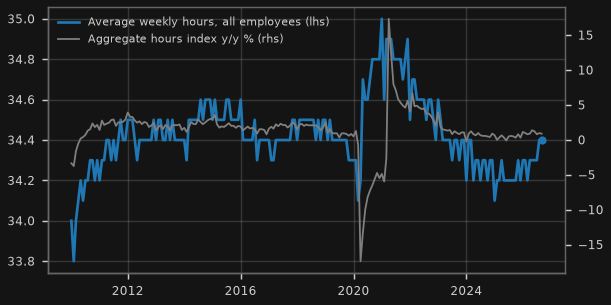
Takeaway: Private workers averaged 34.4 hours a week in Sep 2026 (+0.2 over a year); total hours worked (index 124.7, 2007=100) are +0.9% y/y.
Why it matters for Australia: Firms cut hours before they cut jobs, so falling average hours and a stalling aggregate-hours index are an early read on US labour demand (and hence on US growth, the Fed and global risk appetite).
Rule, caveat & sources caveat
Rule: Aggregate weekly hours index y/y: cooling if < 0.5%; stress if < -1%; heating if > 3%; otherwise steady.
Caveat: All-employee hours series begin March 2006. The Apr-2020 spike in average hours is a composition effect (low-hour workers laid off). Latest two months are revised with the payroll report.
Source: FRED (St Louis Fed): AWHAETP, AWHI; BLS public API (fallback if FRED fails): CES0500000002, CES0500000034
0.0% 4-wk avg 198k
Down 0.8pt over the past week.
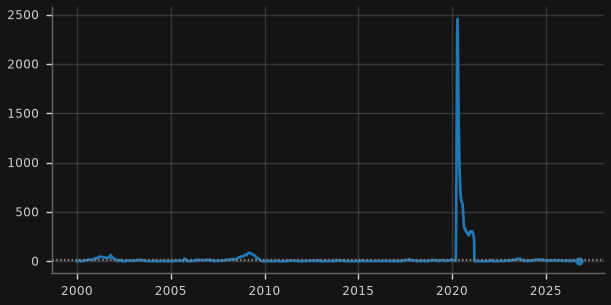
Takeaway: The 4-week average of initial claims is 198k (week to 2026 3 Oct), 0.0% above its 12-month low: below the 15% flag.
Why it matters for Australia: A sustained rise in layoffs from their cycle low has preceded every US recession since the 1970s; it is the fastest hard-data read on whether the labour market is cracking.
Rule, caveat & sources caveat
Rule: % above 52-week low of the 4-week average: stress >= 20%; cooling >= 15% (flag zone 15-20%); otherwise steady.
Caveat: Seasonal adjustment is noisy around holidays, hurricanes and auto-plant retooling; the 15-20% band is a rule of thumb, not an official threshold. Pandemic 2020 values go off the scale.
Source: FRED (St Louis Fed): IC4WSA
Show 4 more us labour market (early signals) chartsHide 4 more us labour market (early signals) chartsUS temporary help services employment (m) · US continuing claims (m) · US JOLTS hires and quits rates (%) · US Treasury withheld income & employment taxes (20-day sum, % y/y)
2.49 m +0.6% over 1y
Down 0.4% on the previous month.
Takeaway: Temp-help employment is 2.49m in Sep 2026, +0.6% y/y and -21.3% from its 2022 peak.
Why it matters for Australia: Temp workers are the first hired and first let go, so temp-help jobs have historically peaked and turned down months before total payrolls.
Rule, caveat & sources caveat
Rule: y/y: cooling if < -3%; stress if < -8%; heating if > +5%; otherwise steady.
Caveat: Structural shift: staffing firms have lost share to gig platforms and direct hiring, so part of the post-2022 decline may be structural rather than cyclical.
Source: FRED (St Louis Fed): TEMPHELPS; BLS public API (fallback if FRED fails): CES6056132001
US continuing claims (m)HEATING
1.72 m -10.7% over 1y
Up 1.0% over the past week.
Takeaway: 1.72m people were claiming in the week to 2026 26 Sep, -11.0% y/y.
Why it matters for Australia: Continuing claims track how hard it is for laid-off workers to find a new job; rising continuing claims with flat initial claims means slow hiring rather than mass layoffs.
Rule, caveat & sources caveat
Rule: y/y: stress >= +25%; cooling >= +10%; heating <= -10%; otherwise steady.
Caveat: Lags initial claims by one week; covers regular state programmes only (excludes federal extensions).
Source: FRED (St Louis Fed): CCSA
3.3% +0.1pp over 1y
Up 0.1pt on the previous month.
Takeaway: Hires 3.3% and quits 1.9% in Aug 2026 (hires +0.1pp y/y; 2015-19 average 3.8%). Real-time Sahm rule 0.00 (Sep 2026) vs the 0.50 recession trigger.
Why it matters for Australia: Low hiring and quitting mean workers are afraid to switch jobs and firms are not adding staff: a 'low-hire, low-fire' market that can tip quickly if layoffs rise.
Rule, caveat & sources caveat
Rule: Hires rate: cooling if below its 2015-19 low (3.5%); otherwise steady. Context: real-time Sahm rule recession signal at >= 0.50.
Caveat: JOLTS lags a month behind payrolls and has a low survey response rate, so revisions can be large. The Sahm indicator is the real-time (as first published) FRED series; the unemployment card shows its history.
Source: FRED (St Louis Fed): JTSHIR, JTSQUR, SAHMREALTIME; BLS public API (fallback if FRED fails): JTS000000000000000HIR, JTS000000000000000QUR
+6.3%
Up 2.8pt over the past week.
Takeaway: Withheld taxes over the 20 business days to 2026 13 Oct are +6.3% y/y, vs a 1-year average of +4.0% and CPI inflation of 3.7% (positive real growth).
Why it matters for Australia: Withheld taxes are deducted from pay cheques and arrive at the Treasury every business day, so they are a near-real-time read of the US wage bill (jobs × hours × pay) well ahead of the monthly payroll report.
Rule, caveat & sources caveat
Rule: Cooling if below its 1-year average by more than 3pp or below CPI inflation (negative real growth); otherwise steady.
Caveat: Noisy: the number of paydays and business days in each 20-day window, tax-law changes (e.g. withholding table changes, payroll-tax deferral in 2020-21) and refunds move it. The DTS changed format in Feb 2023 (Table IV discontinued), so y/y comparisons across Feb 2023-Feb 2024 mix two tables.
Source: US Treasury, Daily Treasury Statement (fiscaldata.treasury.gov API): Table IV 'Withheld Income and Employment Taxes' (to Feb 2023); deposits 'Taxes - Withheld Individual/FICA' (from Feb 2023)
US income, jobs & prices vs trend
-20.2% vs pre-2008 trend +0.8% over 1y
Down 0.1% on the previous month.
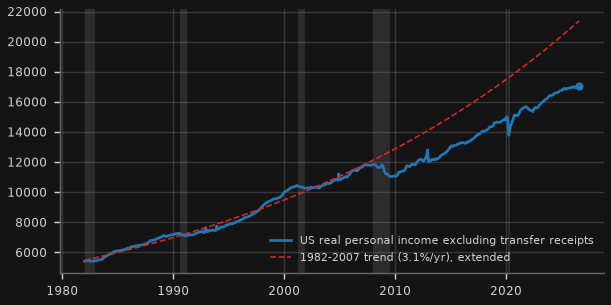
Takeaway: Latest Aug 2026: -20.2% vs its 1982-2007 trend (3.1%/yr then, 2.5%/yr since mid-2009).
Why it matters for Australia: Income earned from work and capital (not government transfers) is what sustains demand; a persistent shortfall vs trend caps how far price shocks can spread into broad inflation.
Rule, caveat & sources caveat
Rule: Context only (no traffic light).
Caveat: Trend is our log-linear fit to Jan 1982 - Dec 2007, extended to today; growth since the Jun 2009 trough is 2.5%/yr. Real = chained 2017 dollars (BEA), revised every release.
Source: FRED (St Louis Fed): W875RX1
-12.0m vs 2010s trend +496.0 over 1y
Unchanged on the previous month; highest in the data back to 1990.
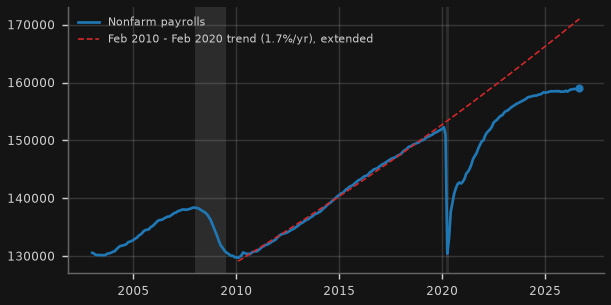
Takeaway: Payrolls 159.0m (Sep 2026), -12.0m vs the 2010s trend line.
Why it matters for Australia: If jobs had kept growing at their pre-pandemic pace there would be millions more; the gap is a measure of the income that is missing from demand.
Rule, caveat & sources caveat
Rule: Context only (no traffic light).
Caveat: Trend is our log-linear fit to Feb 2010 - Feb 2020 payrolls, extended; latest BLS vintage (benchmark revisions move history).
Source: FRED (St Louis Fed): PAYEMS
Show 3 more us income, jobs & prices vs trend chartsHide 3 more us income, jobs & prices vs trend chartsUS real disposable personal income per capita (2017 dollars, SAAR) · US hires as % of the civilian population (JOLTS) vs labour-force participation · US core PCE vs Dallas Fed trimmed-mean PCE inflation (y/y %)
-9.9% vs pre-2008 trend +1.1% over 1y
Down 0.1% on the previous month.
Takeaway: Latest Aug 2026: -9.9% vs its 1982-2007 trend (2.1%/yr then, 1.7%/yr since mid-2009).
Why it matters for Australia: Per-person spending power after tax, adjusted for prices: the household budget constraint behind consumer demand.
Rule, caveat & sources caveat
Rule: Context only (no traffic light).
Caveat: Trend is our log-linear fit to Jan 1982 - Dec 2007, extended to today; growth since the Jun 2009 trough is 1.7%/yr. Real = chained 2017 dollars (BEA), revised every release.
Source: FRED (St Louis Fed): A229RX0
1.89% +0.0pp over 1y
Up 0.02pt on the previous month.
Why it matters for Australia: Hiring relative to the population shows how much churn and opportunity the labour market offers; past hiring droughts preceded falling participation.
Rule, caveat & sources caveat
Rule: Cooling if the 3-month average is below 1.85% (early-2010s levels) and down y/y; heating if above 2.3%; otherwise steady.
Caveat: JOLTS hires level (thousands, SA) divided by the BLS civilian noninstitutional population 16+; participation rate on the right axis. JOLTS starts Dec 2000 and is revised with annual benchmarks.
Source: FRED (St Louis Fed): JTSHIL, CNP16OV, CIVPART
2.19% -0.7pp over 1y
Down 0.09pt on the previous month; lowest since Jul 2021.
Why it matters for Australia: The trimmed mean drops the biggest price moves each month; when it runs below core, inflation is narrow (a few categories) rather than broad.
Rule, caveat & sources caveat
Rule: Heating if trimmed mean > 3%; cooling if < 2%; otherwise steady.
Caveat: Dallas Fed trimmed mean (12-month) and BEA core PCE price index y/y; both revised with each PCE release.
Source: FRED (St Louis Fed): PCETRIM12M159SFRBDAL, PCEPILFE
US credit & bills
12.67% +297bp over 3m
Up 0.5pt over the past week.
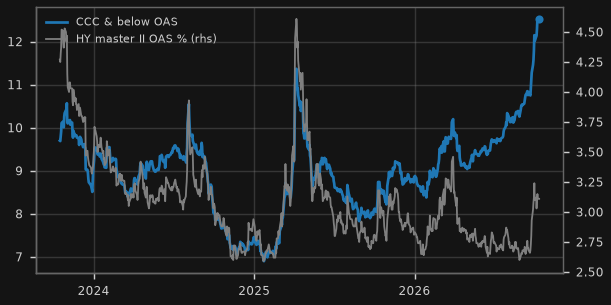
Why it matters for Australia: CCC bonds are the weakest borrowers and widen first when refinancing gets hard; a CCC blow-out while the broad index is calm means stress is concentrated at the margin.
Rule, caveat & sources caveat
Rule: CCC OAS: stress > 12%; cooling 9-12%; heating < 7%; otherwise steady.
Caveat: ICE BofA indices via FRED, which serves only a rolling ~3-year window by licence. HY master OAS on the right axis.
Source: FRED (St Louis Fed): BAMLH0A3HYC, BAMLH0A0HYM2
3m bill 4.26%, +37bp vs SOFR +42bp over 3m
Up 0.05pt over the past week.
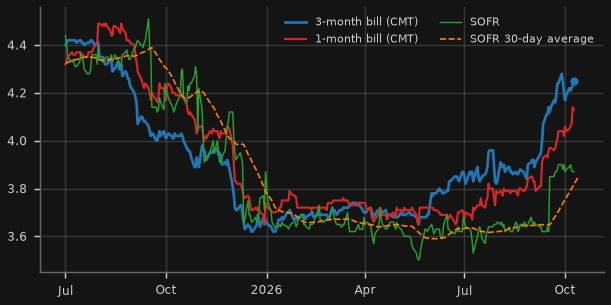
Why it matters for Australia: When bill yields rise above overnight repo (SOFR), markets are pricing higher policy rates or bill supply pressure; bills below SOFR price cuts.
Rule, caveat & sources caveat
Rule: Context only (no traffic light).
Caveat: Treasury constant-maturity bill yields (bond-equivalent) and NY Fed SOFR via FRED. CME Term SOFR is licensed and not shown; the 30-day average SOFR is the free backward-looking proxy.
Source: FRED (St Louis Fed): DGS1MO, DGS3MO, SOFR, SOFR30DAYAVG
Show 1 more us credit & bills chartHide 1 more us credit & bills chartUS leveraged-loan ETF prices: FLBL and BKLN (US$)
22.73 US$ -1.0% over 3m
Unchanged over the past week.
Why it matters for Australia: Leveraged loans are floating-rate debt of lower-rated companies; falling loan prices signal lenders demanding more for risk as cash flows weaken.
Rule, caveat & sources caveat
Rule: Cooling if FLBL is > 2% below its 3-month high; stress if > 4% below; otherwise steady (price-only, so a slow drift from distributions is normal).
Caveat: Exchange prices (not total return: monthly distributions are excluded, so price drifts down over time even in calm markets). BKLN on the right axis.
Source: Yahoo Finance chart endpoint (unofficial): FLBL, BKLN
Global credit cycle (BIS)
7.3% +2.1pp over 1y
Down 1.1pt on the previous quarter.
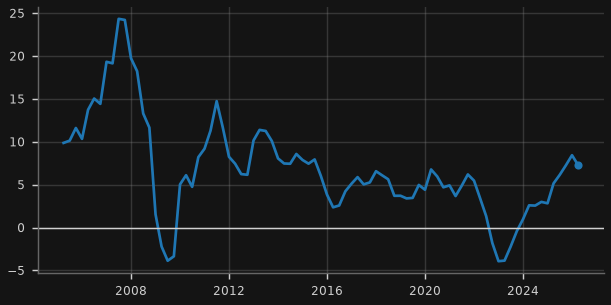
Why it matters for Australia: The offshore dollar credit cycle: Asian corporates and sovereigns are among the biggest users.
Rule & sources
Rule: Heating > 8%; cooling < 0%; otherwise steady.
Source: BIS Data Portal (WS_GLI): Q.USD.3P.N.A.I.B.771
Credit-to-GDP gaps (BIS, pp)HEATING
-9.7 pp +3.8pp over 1y
Up 0.3pt on the previous quarter; highest since Q3 2020.
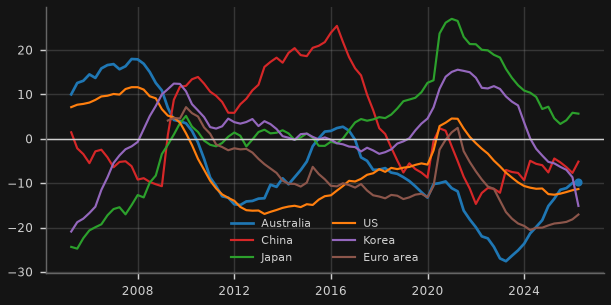
Why it matters for Australia: Credit far above trend has preceded most banking crises; a negative gap means deleveraging.
Rule, caveat & sources caveat
Rule: Per economy: stress > +10pp; heating +2 to +10; steady -2 to +2; cooling < -2. Status shown is for the highest gap.
Caveat: Latest value field shows Australia; the gap is a one-sided HP-filter trend and is unreliable for China/Japan structural shifts.
Source: BIS Data Portal (WS_CREDIT_GAP): Q.AU+CN+JP+US+KR+XM.P.A.C
Show 3 more global credit cycle (bis) chartsHide 3 more global credit cycle (bis) chartsPrivate-sector debt service ratios (BIS, % of income) · Private credit impulse (BIS, % of GDP) · Real residential property prices (BIS, y/y)
20.3% -0.3pp over 1y
Up 0.2pt on the previous quarter.
Why it matters for Australia: Direct test of the thesis: the share of income going to interest and principal.
Rule & sources
Rule: Australia vs its own 10-year average: stress >= +2pp; cooling (restrictive) >= +1pp; heating <= -1pp; otherwise steady.
Source: BIS Data Portal (WS_DSR): Q.AU+CN+JP+US+KR.P
0.2 % GDP -2.2 over 1y
Down 0.1pt on the previous quarter.
Why it matters for Australia: A positive impulse adds to demand growth; Australia's is driven by housing and business credit.
Rule, caveat & sources caveat
Rule: 4-quarter change in 4-quarter credit flow as % of GDP: heating > +1pp; cooling < -1pp; otherwise steady. Applied to Australia.
Caveat: Derived from BIS total credit to private non-financial sector (all lenders, market value).
Source: BIS Data Portal (WS_TC): Q.AU+US+JP+KR.P.A.M.XDC+770.A
4.2% +2.2pp over 1y
Down 1.8pt on the previous quarter.
Why it matters for Australia: Property is the main collateral for credit across the region.
Rule, caveat & sources caveat
Rule: Context only (no traffic light).
Caveat: CPI-deflated; coverage differs by country (China = 70-city new homes).
Source: BIS Data Portal (WS_SPP): Q.AU+CN+JP+US+KR.R.771
About / sources. A rules-based monitor of the Australian macro and credit cycle from an Asian and US-funding perspective. All data are free public sources: RBA, ABS, BIS, OECD, FRED (St Louis Fed), Federal Reserve Board (H.4.1, GSW yield curve), NY Fed Markets API (reference rates, primary dealer statistics), Japan Ministry of Finance, Cboe index history files, ETF issuer files (State Street, ProShares, Direxion, iShares, Invesco, Roundhill), Fed Financial Accounts (Z.1), Robert Shiller's data, China NBS releases, ASIC, World Bank Pink Sheet, Geopolitical Risk / EPU indices, Yahoo Finance (unofficial chart endpoint). Each card names its series IDs and links to the source; release lags differ by series. Machine-readable latest values: data/latest_summary.csv.
Disclaimer: for information and education only; not financial, investment or tax advice. Data may be revised, delayed or contain errors; check the original source before relying on any figure.