Global trade & imbalances: current accounts, trade balances & capital flows
Last updated: 2026 16 Oct, 18:13 AWST (Perth) · 18 charts. Key charts first; more under Show more. Overview & traffic lights
Traffic-light key
HEATING running hot / accelerating / tightening pressure building (e.g. inflation above target, rapid credit growth, rising yields, booming asset prices)
STEADY inside its normal range under the stated rule
COOLING slowing / weakening, or a restrictive setting that is exerting cooling pressure (e.g. high real rates, inverted curve)
STRESS dislocation signal: spreads or insolvencies surging, carry unwind, sharp drawdown, labour-market break (Sahm-style)
INFO context chart only, no traffic-light rule
STEADY inside its normal range under the stated rule
COOLING slowing / weakening, or a restrictive setting that is exerting cooling pressure (e.g. high real rates, inverted curve)
STRESS dislocation signal: spreads or insolvencies surging, carry unwind, sharp drawdown, labour-market break (Sahm-style)
INFO context chart only, no traffic-light rule
Summary from the latest data. The 18 charts on this page give context and carry no traffic-light rules.
Trade balances are the other side of saving and spending decisions: economies that save more than they invest at home run current account surpluses and lend abroad; economies that spend more than they produce run deficits and borrow. The cards track those balances, the saving/consumption mix behind them, where the goods go and how the money flows back. Latest data: Current account balances, 2025 (% of GDP, IMF): Taiwan +20.0, Korea +6.5, Japan +4.9, Germany +4.5, China +3.7, US -3.8. IMF projections for 2026: Taiwan +22.0%, Korea +18.8%, China +4.0%, US -3.9% of GDP. China's household consumption was 40.0% of GDP in 2024 (world 56.6%), investment 40.5% (world 26.3%). China's goods trade surplus was US$114bn in Aug 2026 (seasonally adjusted); US$1.22tn over 12 months. US goods & services deficit US$105.6bn in Aug 2026; US$794bn over 12 months. US current account -3.0% of GDP (Q2 2026); net international investment position US$-22.4tn (-69% of GDP, Q2 2026). Foreign holdings of US Treasuries (Jul 2026): Total US$9,248bn (+139bn y/y); Japan US$1,104bn (-52bn y/y); United Kingdom US$998bn (+102bn y/y); China US$618bn (-78bn y/y). World trade volume Jul 2026: +6.0% y/y (CPB, released 2026 21 Sep).
Current account balances
3.7% +1.3pp over 1y
Up 1.3pt on the previous year; highest since 2010.
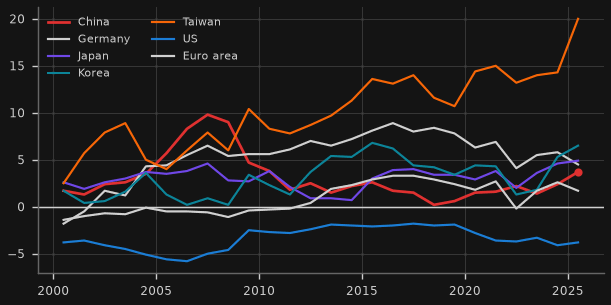
Why it matters: Surplus economies produce more than they spend at home and lend the difference abroad; deficit economies spend more than they produce and borrow it. The balances must net to roughly zero globally.
Rule, caveat & sources caveat
Rule: Context only (no traffic light).
Caveat: Annual; actual data to 2025 (latest year may be partly estimated by the IMF). Taiwan's surplus is the largest relative to GDP among major economies.
Source: IMF World Economic Outlook via DataMapper API: BCA_NGDPD (current account, % GDP): CHN, DEU, JPN, KOR, TWN, USA, EURO
Korea +18.8%, Taiwan +22.0%
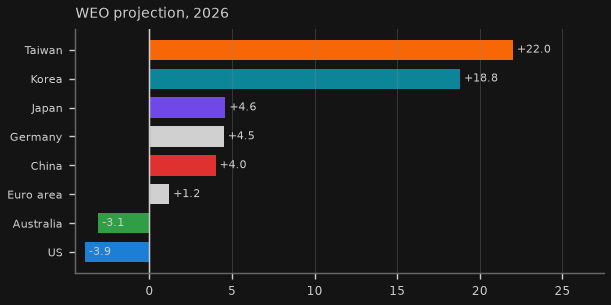
Why it matters: The IMF's forecasts show where the big imbalances are heading this year.
Rule, caveat & sources caveat
Rule: Context only (no traffic light).
Caveat: Forecast, not data. Korea's jump (2025 +6.5% to +18.8%) was checked against the Bank of Korea: its Jan-Aug 2026 current account surplus was US$279bn (Aug US$46.1bn, second-largest month on record), and the BoK expects about US$450bn for 2026, consistent with the IMF's ~US$422bn. Semiconductor exports are driving it.
Source: IMF World Economic Outlook via DataMapper API: BCA_NGDPD (current account, % GDP): CHN, DEU, JPN, KOR, TWN, USA, EURO
China: consumption, investment & the trade surplus
40.0% +0.4pp over 1y
Up 0.4pt on the previous year; highest since 2004.
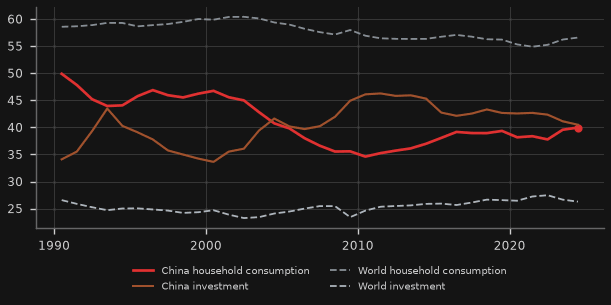
Why it matters: A low household-consumption share and a high investment share mean saving exceeds what is invested at home; the excess shows up as a trade surplus. Rebalancing means households getting a larger share of income.
Rule, caveat & sources caveat
Rule: Context only (no traffic light).
Caveat: Annual, about a one-year lag. Household (private) consumption only; adding government consumption gives roughly 53-56% for China vs about 75% globally.
Source: World Bank World Development Indicators API: NE.CON.PRVT.ZS, NE.GDI.TOTL.ZS (CHN, WLD)
1,216 US$bn +5.5% over 1y
Up 1.4% on the previous month.
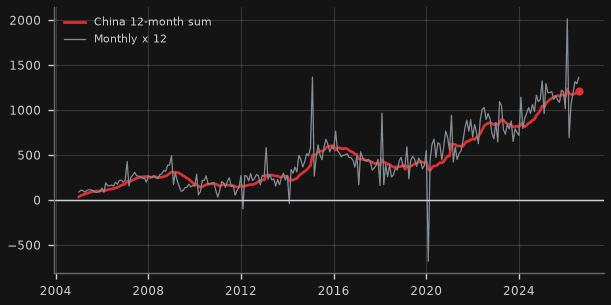
Why it matters: China's surplus is the flip side of its high saving: output that is not consumed or invested at home is sold abroad.
Rule, caveat & sources caveat
Rule: Context only (no traffic light).
Caveat: OECD Main Economic Indicators via FRED, seasonally adjusted; differs slightly from the customs headline (not seasonally adjusted).
Source: FRED (St Louis Fed): XTEXVA01CNM667S, XTIMVA01CNM667S
Show 1 more china: consumption, investment & the trade surplus chartHide 1 more china: consumption, investment & the trade surplus chartChina exports vs imports
24.8% +13.0pp over 3m
Up 1.5pt on the previous month; highest since Nov 2021.
Why it matters: Exports growing faster than imports widens the surplus; weak imports also signal weak domestic demand.
Rule & sources
Rule: Context only (no traffic light).
Source: FRED (St Louis Fed): XTEXVA01CNM667S, XTIMVA01CNM667S
Asia & Europe: exports and trade balances
67.3% +17.2pp over 3m
Up 5.0pt on the previous month; highest in the data back to 1996.
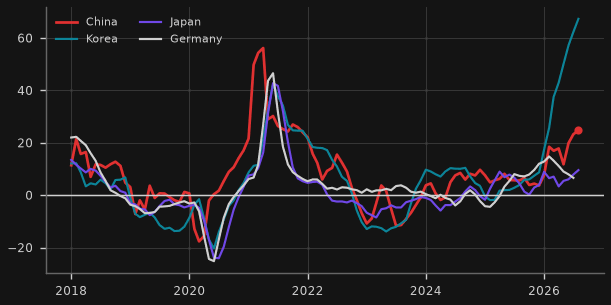
Why it matters: Export momentum in the main surplus economies shows how much of their output is being absorbed by the rest of the world; Korea is an early read on the chip cycle.
Rule, caveat & sources caveat
Rule: Context only (no traffic light).
Caveat: Taiwan is not covered by OECD/FRED trade series and has no free bulk API, so it is shown via the IMF current account card instead.
Source: FRED (St Louis Fed): XTEXVA01KRM667S, XTEXVA01CNM667S, XTEXVA01JPM667S, XTEXVA01DEM667S
242 US$bn +179.1 over 1y
Up 13.4% on the previous month; highest in the data back to 1995.
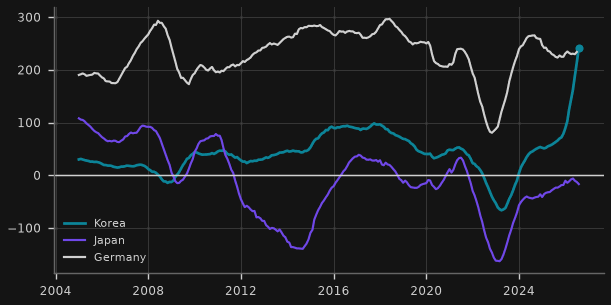
Why it matters: Germany and Korea run persistent goods surpluses; Japan's goods balance swings with energy import costs while its income from foreign assets keeps its current account positive.
Rule & sources
Rule: Context only (no traffic light).
Source: FRED (St Louis Fed): XTEXVA01KRM667S, XTIMVA01KRM667S, XTEXVA01JPM667S, XTIMVA01JPM667S, XTEXVA01DEM667S, XTIMVA01DEM667S
US: trade deficit & external position
-794 US$bn +237.2 over 1y
Down 46 US$bn on the previous month.
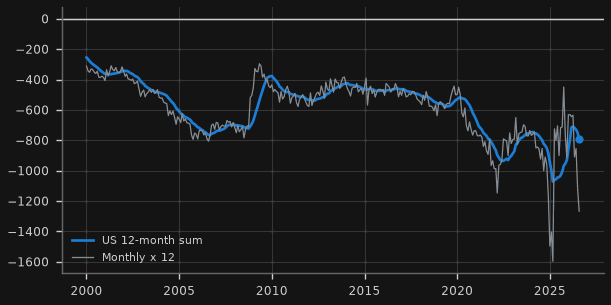
Why it matters: The US is the main absorber of other economies' surpluses: its deficit is the counterpart of foreign saving flowing into US assets.
Rule, caveat & sources caveat
Rule: Context only (no traffic light).
Caveat: Census/BEA balance of payments basis, seasonally adjusted. Swings in early 2025 reflect imports pulled forward ahead of tariffs.
Source: FRED (St Louis Fed): BOPGSTB
-68.9% +1.1pp over 1y
Down 2.2pt on the previous quarter.
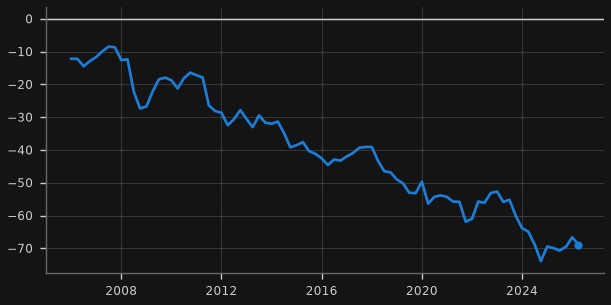
Why it matters: Years of deficits accumulate as net foreign claims on the US; the position also moves with US equity prices and the dollar.
Rule, caveat & sources caveat
Rule: Context only (no traffic light).
Caveat: Market-value basis: a US equity rally makes the position more negative even without new borrowing.
Source: FRED (St Louis Fed): IIPUSNETIQ, GDP
Show 2 more US: trade deficit & external position chartsHide 2 more US: trade deficit & external position chartsUS current account balance · US goods imports by source, 12-month sum
-3.0% +0.3pp over 1y
Down 0.4pt on the previous quarter.
Why it matters: The current account is the gap between US saving and US investment; a deficit must be financed by net capital inflows.
Rule, caveat & sources caveat
Rule: Context only (no traffic light).
Caveat: IEABC (quarterly, not annualised) x 4 divided by nominal GDP (annualised).
Source: FRED (St Louis Fed): IEABC, GDP
273 US$bn -28.3% over 1y
Up 0.7% on the previous month.
Why it matters: Shows trade rerouting: lower direct US imports from China alongside rising imports from Mexico, Vietnam and Taiwan.
Rule, caveat & sources caveat
Rule: Context only (no traffic light).
Caveat: Census basis, not seasonally adjusted (hence 12-month sums).
Source: FRED (St Louis Fed): IMPCH, IMPMX, IMP5520, IMP5830
Capital flows: foreign holdings of US Treasuries
618 US$bn -77.6 over 1y
Down 2.4% on the previous month; lowest in the data back to 2011.
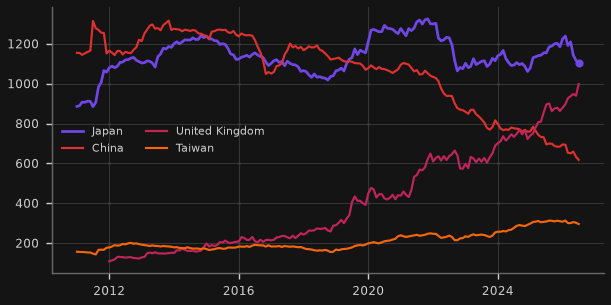
Why it matters: Surplus economies recycle their savings into US assets. China's direct holdings have fallen for a decade while holdings booked in financial centres (UK, Belgium) have risen.
Rule, caveat & sources caveat
Rule: Context only (no traffic light).
Caveat: Custodial basis: holdings are attributed to the country where securities are held, so UK, Belgian, Luxembourg and Cayman figures include other countries' holdings.
Source: US Treasury TIC: Major Foreign Holders of Treasury Securities: slt_table5.txt (latest 13 months) + mfhhis01.txt (history)
Show 2 more capital flows: foreign holdings of US treasuries chartsHide 2 more capital flows: foreign holdings of US treasuries chartsTotal foreign holdings of US Treasuries · US net foreign investment
9,248 US$bn +1.5% over 1y
Down 0.5% on the previous month.
Why it matters: Foreign demand for Treasuries is the main channel through which surplus savings finance the US deficit.
Rule & sources
Rule: Context only (no traffic light).
Source: US Treasury TIC: Major Foreign Holders of Treasury Securities: slt_table5.txt (latest 13 months) + mfhhis01.txt (history)
-1,096 US$bn +56.9 over 1y
Down 30 US$bn on the previous quarter.
Why it matters: Net lending to (positive) or borrowing from (negative) the rest of the world in the national accounts: the capital-account counterpart of the current account.
World trade volumes
116.8 +6.0% over 1y
Up 0.3% on the previous month; highest in the data back to 2000.
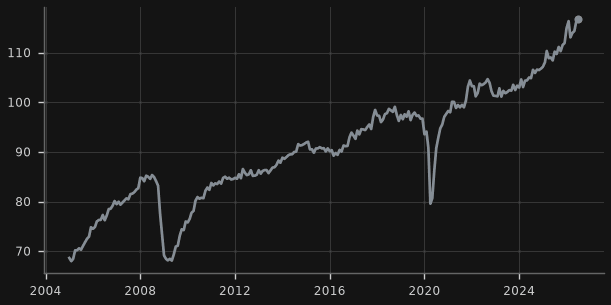
Why it matters: Global trade volumes show whether surpluses are being absorbed through rising world demand or through shifts in market share.
Rule, caveat & sources caveat
Rule: Context only (no traffic light).
Caveat: Seasonally adjusted volumes; file discovered from the CPB 'latest' page (CPB-world-trade-monitor-july-2026.xlsx).
Source: CPB World Trade Monitor (xlsx): tgz_w1_qnmi_sn
139.3 +11.1% over 1y
Down 2.7% on the previous month.
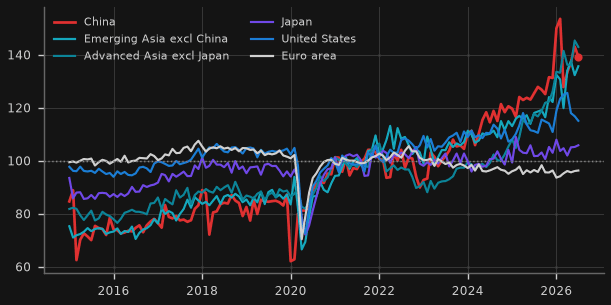
Why it matters: Who is supplying the world's goods: China and the rest of Asia have taken share since 2021 while euro-area volumes have stagnated.
Rule & sources
Rule: Context only (no traffic light).
Source: CPB World Trade Monitor (xlsx): xgz_cn_qnmi_sn, xgz_a5_qnmi_sn, xgz_a3_qnmi_sn, xgz_jp_qnmi_sn, xgz_us_qnmi_sn, xgz_e6_qnmi_sn
Show 2 more world trade volumes chartsHide 2 more world trade volumes chartsImport volumes by region · Australia: China's share of goods exports
107.2 +5.4% over 1y
Up 0.3% on the previous month.
Why it matters: Import volumes show where demand is coming from; flat Chinese imports alongside rising exports is the trade-side picture of weak domestic demand.
Rule & sources
Rule: Context only (no traffic light).
Source: CPB World Trade Monitor (xlsx): mgz_cn_qnmi_sn, mgz_a5_qnmi_sn, mgz_us_qnmi_sn, mgz_e6_qnmi_sn, mgz_jp_qnmi_sn
35.2% +1.8pp over 1y
Down 0.2pt on the previous month.
Why it matters: Australia supplies the raw materials for China's investment-heavy growth; a shift toward consumption would change what China buys.
Rule & sources
Rule: Context only (no traffic light).
Source: ABS Data API (MERCH_EXP): TOT.CHIN+TOT.TOT.M
About / sources. A rules-based monitor of the Australian macro and credit cycle from an Asian and US-funding perspective. All data are free public sources: RBA, ABS, BIS, OECD, FRED (St Louis Fed), Federal Reserve Board (H.4.1, GSW yield curve), NY Fed Markets API (reference rates, primary dealer statistics), Japan Ministry of Finance, Cboe index history files, ETF issuer files (State Street, ProShares, Direxion, iShares, Invesco, Roundhill), Fed Financial Accounts (Z.1) and Distributional Financial Accounts, Atlanta Fed Wage Growth Tracker, BEA (NIPA personal consumption and income), NY Fed Household Debt and Credit Report, ABS Selected Living Cost Indexes, Robert Shiller's data, IMF World Economic Outlook (DataMapper API), World Bank WDI, US Treasury TIC, CPB World Trade Monitor, China NBS releases, ASIC, World Bank Pink Sheet, Geopolitical Risk / EPU indices, Yahoo Finance (unofficial chart endpoint). Each card names its series IDs and links to the source; release lags differ by series. Machine-readable latest values: data/latest_summary.csv.
Disclaimer: for information and education only; not financial, investment or tax advice. Data may be revised, delayed or contain errors; check the original source before relying on any figure.