Two-speed consumer: wages, wealth, living costs & credit stress by household group
Last updated: 2026 16 Oct, 13:30 AWST (Perth) · 12 charts. Key charts first; more under Show more. Overview & traffic lights
Traffic-light key
HEATING running hot / accelerating / tightening pressure building (e.g. inflation above target, rapid credit growth, rising yields, booming asset prices)
STEADY inside its normal range under the stated rule
COOLING slowing / weakening, or a restrictive setting that is exerting cooling pressure (e.g. high real rates, inverted curve)
STRESS dislocation signal: spreads or insolvencies surging, carry unwind, sharp drawdown, labour-market break (Sahm-style)
INFO context chart only, no traffic-light rule
STEADY inside its normal range under the stated rule
COOLING slowing / weakening, or a restrictive setting that is exerting cooling pressure (e.g. high real rates, inverted curve)
STRESS dislocation signal: spreads or insolvencies surging, carry unwind, sharp drawdown, labour-market break (Sahm-style)
INFO context chart only, no traffic-light rule
Summary from the latest data. The 12 charts on this page give context and carry no traffic-light rules. In the latest data, US share of household net worth by wealth group is at its highest since the data begin in 1989, and US real net worth growth by wealth group is at its highest since Q3 2021.
How households at different points of the income and wealth distribution are faring, from free official data: wage growth by wage quartile, wealth by group, the share of spending on essentials and the income left after them, delinquency by loan type and age (US); living costs by household type, real wages, mortgage payments and essential vs discretionary spending (Australia).
Latest data. US median wage growth (12-mo avg, Sep 2026): lowest wage quartile 3.4%, highest 3.8%. US net worth shares (2026 Q2): top 1% 32.5%, bottom 50% 2.3%; real growth over the year top 1% +12.9%, bottom 50% +3.3%. Housing & utilities, health care, insurance and financial services were 43.3% of US consumer spending in Aug 2026 (42.7% in 2019); with food at home and energy goods 52.6%. Real disposable income +1.3% y/y; after essentials +0.1% (Aug 2026). US balances 90+ days delinquent (2026 Q2): credit cards 12.9%, auto 5.5%, mortgages 0.99%. Australian living costs, year to Jun qtr 2026: employees 3.7%, age pensioners 4.7%, other transfer recipients 4.6%, self-funded retirees 3.8% (CPI 3.9%). Wages (WPI) deflated by employee living costs are -9.2% vs Mar qtr 2021; by CPI -5.2%. Housing loan interest charged was 6.0% of household disposable income in the Mar qtr 2026 (scheduled repayments 9.4%). Household spending (Aug 2026, nominal y/y): discretionary +7.2%, non-discretionary +6.3%; monthly CPI 4.0%.
US: wages & wealth by group
3.4% -0.1pp over 1y
Down 0.3pt on the previous month; lowest since Aug 2025.
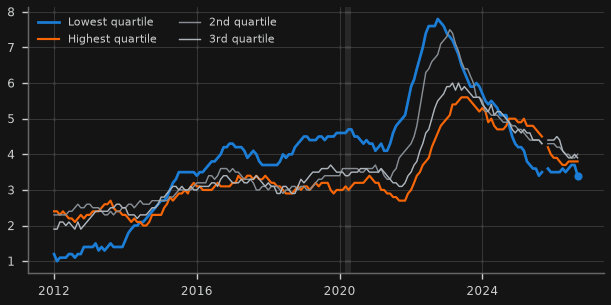
Why it matters: Shows whether lower-paid workers' pay is rising faster or slower than higher-paid workers'.
Rule, caveat & sources caveat
Rule: Context only (no traffic light).
Caveat: Lowest minus highest quartile: -0.4pp (peak +3.7pp in Jul 2022). Median of individual year-on-year hourly wage changes (CPS), 12-month moving average.
Source: Atlanta Fed Wage Growth Tracker (xlsx): sheet 'Average Wage Quartile' (12-month moving average of median wage growth)
32.5% +1.4pp over 1y
Up 0.8pt on the previous quarter; highest in the data back to 1989.
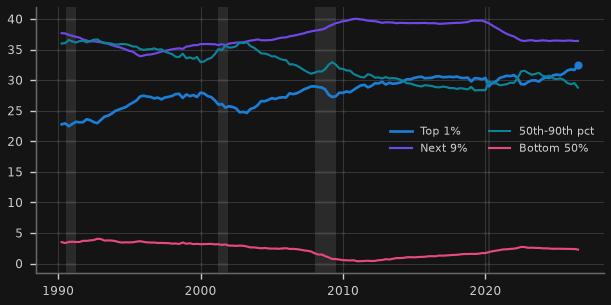
Why it matters: Who holds household wealth, and how that is shifting.
Rule, caveat & sources caveat
Rule: Context only (no traffic light).
Caveat: Bottom 50% share 2.3% (4.3 of 186 US$tn). Quarterly; DFA allocates the Financial Accounts totals using the Survey of Consumer Finances.
Source: Federal Reserve Distributional Financial Accounts (dfa.zip): dfa-networth-levels.csv; deflated by FRED PCEPI
Show 1 more US: wages & wealth by group chartHide 1 more US: wages & wealth by group chartUS real net worth growth by wealth group
+12.9% bottom 50% +3.3%
Up 4.5pt on the previous quarter; highest since Q3 2021.
Why it matters: Real (inflation-adjusted) change in each group's wealth over the past year.
Rule, caveat & sources caveat
Rule: Context only (no traffic light).
Caveat: Bottom-50% growth rates are from a small base and swing widely.
Source: Federal Reserve Distributional Financial Accounts (dfa.zip): dfa-networth-levels.csv; deflated by FRED PCEPI
US: essential spending & income after essentials
43.3% -0.0pp over 1y
Down 0.2pt on the previous month.
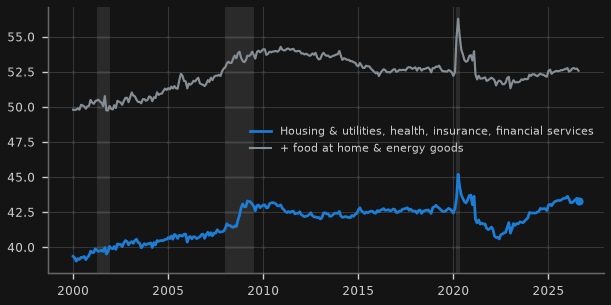
Why it matters: Spending on housing, health, insurance and financial services is hard to cut; a rising share leaves less for everything else.
Rule, caveat & sources caveat
Rule: Context only (no traffic light).
Caveat: Financial services include services 'furnished without payment' (imputed bank services, no cash changes hands): imputed plus fees 5.5% of spending. Housing includes owners' imputed rent.
Source: BEA NIPA Table 2.4.5U via NipaDataM.txt: DPCERC, DHUTRC, DHLCRC, DINSRC, DIMPRC, DOFIRC, DFXARC, DGOERC, A067RC; PCEPI
115.1 +0.1% over 1y
Down 0.3% on the previous month.
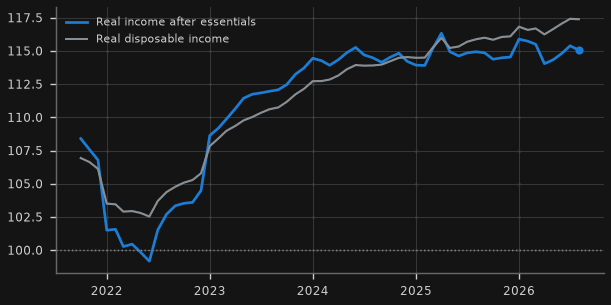
Why it matters: What households have left, in real terms, after paying for essentials.
Rule, caveat & sources caveat
Rule: Context only (no traffic light).
Caveat: Nominal disposable income minus nominal spending on the essentials above (incl. food at home and energy goods), deflated by the PCE price index. Card chart starts late 2021 (2020-21 pandemic transfers spike to ~165); the enlarged view has full history.
Source: BEA NIPA Table 2.4.5U via NipaDataM.txt: DPCERC, DHUTRC, DHLCRC, DINSRC, DIMPRC, DOFIRC, DFXARC, DGOERC, A067RC; PCEPI
US: household credit stress
12.9% +0.7pp over 1y
Down 0.2pt on the previous quarter.
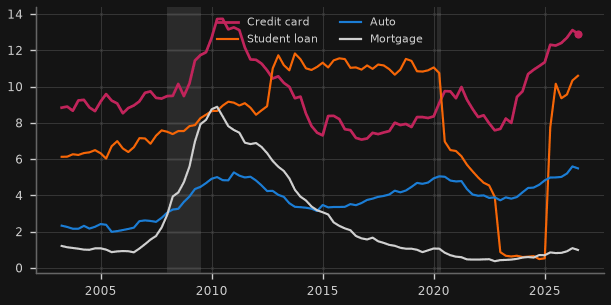
Why it matters: Serious delinquency shows where household budgets are breaking first.
Rule, caveat & sources caveat
Rule: Context only (no traffic light).
Caveat: Latest report used: 2026 Q2. The report file name changes each quarter; the newest available file is used, else the last cached copy. Student-loan delinquency reporting was paused 2020-24.
Source: NY Fed Household Debt and Credit Report (xlsx): Page 12 (90+ days delinquent by loan type), Page 27 (card transition to 90+ by age)
10.1% +0.2pp over 1y
Up 0.4pt on the previous quarter.
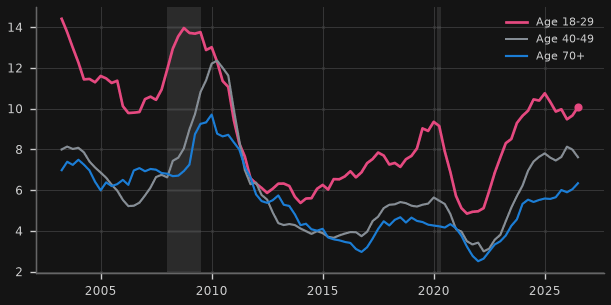
Why it matters: Younger borrowers typically have less savings and are first to fall behind.
Rule, caveat & sources caveat
Rule: Context only (no traffic light).
Caveat: Share of card balances transitioning into 90+ days delinquency, 4-quarter sum; report 2026 Q2.
Source: NY Fed Household Debt and Credit Report (xlsx): Page 12 (90+ days delinquent by loan type), Page 27 (card transition to 90+ by age)
Australia: living costs & real wages by household type
3.7% +1.2pp over 1y
Up 1.1pt on the previous quarter.
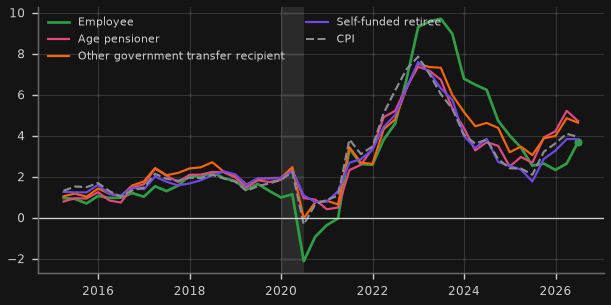
Why it matters: Living cost indexes measure price change for what each household type actually pays, including mortgage interest (which the CPI excludes).
Rule & sources
Rule: Context only (no traffic light).
Source: ABS Data API (LCI): 1.10001.P1+P2+P3+P4.50.Q; RBA table G1: GCPIAG
90.8 -0.5% over 1y
Down 0.9% on the previous quarter.
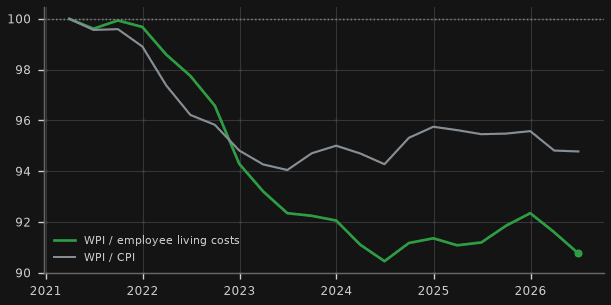
Why it matters: Whether pay is keeping up with what working households pay, including mortgage interest.
Rule & sources
Rule: Context only (no traffic light).
Source: ABS Data API (WPI): THRPEB.7.TOT.10.AUS.Q (total hourly rates excl. bonuses, original); ABS Data API (LCI): 1.10001.P1.50.Q; RBA table G1: GCPIAG
Show 1 more australia: living costs & real wages by household type chartHide 1 more australia: living costs & real wages by household type chartAustralian living costs by household type since Mar qtr 2021
130.5 +3.7% over 1y
Up 1.5% on the previous quarter; highest in the data back to 2021.
Why it matters: Cumulative cost increase since just before the inflation surge, by household type.
Rule & sources
Rule: Context only (no traffic light).
Source: ABS Data API (LCI): 1.10001.P1+P2+P3+P4.50.Q; RBA table G1: GCPIAG
Australia: mortgage costs & household spending
6.0% -0.5pp over 1y
Up 0.1pt on the previous quarter.
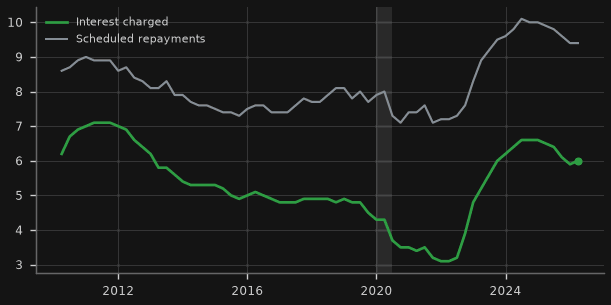
Why it matters: The share of income going to mortgage interest and repayments: the main channel through which rate changes split households.
Rule, caveat & sources caveat
Rule: Context only (no traffic light).
Caveat: Averaged over all households, including those without a mortgage; borrowers' own ratios are much higher.
Source: RBA table E13: LPHTICRI, LPHTSPRI
7.2% +2.9pp over 1y
Down 0.6pt on the previous month.
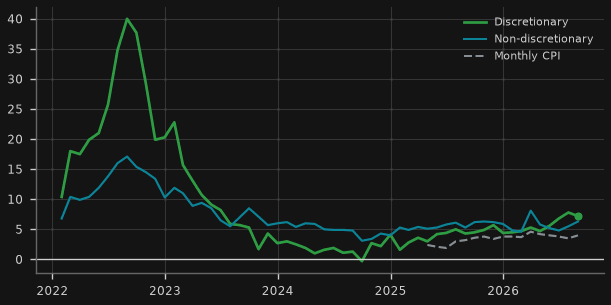
Why it matters: Discretionary spending is what households cut first when budgets tighten.
Rule, caveat & sources caveat
Rule: Context only (no traffic light).
Caveat: Seasonally adjusted, current prices. Approximate real growth (nominal y/y minus monthly CPI y/y): discretionary +3.2%, non-discretionary +2.3%; ABS does not publish volumes for this split.
Source: ABS Data API (HSI_M): 9.TOT+3+4.CUR.20.AUS.M; ABS Data API (CPI): 3.10001.10.50.M
About / sources. A rules-based monitor of the Australian macro and credit cycle from an Asian and US-funding perspective. All data are free public sources: RBA, ABS, BIS, OECD, FRED (St Louis Fed), Federal Reserve Board (H.4.1, GSW yield curve), NY Fed Markets API (reference rates, primary dealer statistics), Japan Ministry of Finance, Cboe index history files, ETF issuer files (State Street, ProShares, Direxion, iShares, Invesco, Roundhill), Fed Financial Accounts (Z.1) and Distributional Financial Accounts, Atlanta Fed Wage Growth Tracker, BEA (NIPA personal consumption and income), NY Fed Household Debt and Credit Report, ABS Selected Living Cost Indexes, Robert Shiller's data, China NBS releases, ASIC, World Bank Pink Sheet, Geopolitical Risk / EPU indices, Yahoo Finance (unofficial chart endpoint). Each card names its series IDs and links to the source; release lags differ by series. Machine-readable latest values: data/latest_summary.csv.
Disclaimer: for information and education only; not financial, investment or tax advice. Data may be revised, delayed or contain errors; check the original source before relying on any figure.